MySQL 8.0 Study 002 Tips
学习系列
- sysbench 1.0.20安装和简单测试监控
- MySQL 性能分析工具
- mysqltuner.pl
- tuning-primer.sh
- pt-variable-advisor
- pt-query-digest
- Prometheus+Grafana监控MySQL
01. sysbench 1.0.20安装和简单测试监控
测试环境:
- Linux 8/64_x86
- MySQL 8.0.32 社区版
下载地址:https://github.com/akopytov/sysbench
# dnf install -y make automake libtool
# tar -zxvf sysbench-1.0.20.tar.gz
# cp -R sysbench-1.0.20/ /opt
# cd /opt
# ln -s sysbench-1.0.20/ sysbench
# cd sysbench
# ./autogen.sh
# ./configure --prefix /usr/local/sysbench --with-mysql --with-mysql-includes=/opt/mysql/8.0.32/include --with-mysql-libs=/opt/mysql/8.0.32/lib
# make && make install
# ln -s /usr/local/sysbench/bin/* /usr/bin
# sysbench --version

sysbench 1.0.20
起一个8.0.23的mysql:
# dbdeployer --sandbox-binary=/opt/mysql/ deploy multiple 8.0.23 -n 2
# dbdeployer --sandbox-binary=/opt/mysql deploy single 8.0.32
# dbdeployer deploy single 8.0.32 --sandbox-binary=/opt/mysql/ --bind-address=0.0.0.0 --port=8032 --remote-access='%' --native-auth-plugin --gtid --my-cnf-options="skip_name_resolve" --pre-grants-sql="create user lin@'%' identified with mysql_native_password by 'mysql';grant all on *.* to 'lin'@'%' with grant option;flush privileges;"

mysql -ulin -pmysql -h192.168.56.130 -P8032
准备一张表:
sysbench \
/usr/local/sysbench/share/sysbench/oltp_update_index.lua \
--mysql-user=msandbox \
--mysql_password=msandbox \
--mysql-host=127.0.0.1 \
--mysql-port=8032 \
--mysql-db=test \
--tables=1 \
--table-size=1000000 \
--threads=10 \
--events=0 \
--report-interval=3 \
--db-ps-mode=disable \
prepare
开多一个窗口查看:
mysqladmin -ulin -h192.168.56.130 -P8032 -p'mysql' extended-status -i1|awk 'BEGIN{local_switch=0}
     $2 ~ /Queries$/            {q=$4-lq;lq=$4;}
     $2 ~ /com_commit$/         {c=$4-lc;lc=$4;}
     $2 ~ /Com_rollback$/       {r=$4-lr;lr=$4;}
     $2 ~ /Com_select$/       {s=$4-ls;ls=$4;}
     $2 ~ /Com_update$/       {u=$4-lu;lu=$4;}
     $2 ~ /Com_insert$/       {i=$4-li;li=$4;}
     $2 ~ /Com_delete$/       {d=$4-ld;ld=$4;}
     $2 ~ /Innodb_rows_read$/       {irr=$4-lirr;lirr=$4;}
     $2 ~ /Innodb_rows_deleted$/       {ird=$4-lird;lird=$4;}
     $2 ~ /Innodb_rows_inserted$/       {iri=$4-liri;liri=$4;}
     $2 ~ /Innodb_rows_updated$/       {iru=$4-liru;liru=$4;}
     $2 ~ /Innodb_buffer_pool_read_requests$/       {ibprr=$4-libprr;libprr=$4;}
     $2 ~ /Innodb_buffer_pool_reads$/       {ibpr=$4-libpr;libpr=$4;}
     $2 ~ /Threads_connected$/  {tc=$4;}
     $2 ~ /Threads_running$/    {tr=$4;
        if(local_switch==0)
                {local_switch=1; count=16}
        else {
                if(count>15) {
                    count=0;
                    print "----------------------------------------------------------------------------------------------------------------------------------------------- ";
                    print "-------- Time -------|  QPS | Commit Rollback TPS | select insert update delete |  read inserted updated deleted | logical physical | Tcon Trun";
                    print "----------------------------------------------------------------------------------------------------------------------------------------------- ";
                }else{
                    count+=1;
                    printf "%s | %-5d| %-6d %-7d %-5d| %-7d %-7d %-5d %-6d| %-7d %-7d %-7d %-7d| %-6d  %-9d| %-4d %-2d \n", strftime("%Y/%m/%d/ %H:%M:%S"),q,c,r,c+r,s,u,i,d,irr,ird,iri,iru,ibprr,ibpr,tc,tr;
                }
        }
}'
测试下性能:
sysbench \
/usr/local/sysbench/share/sysbench/oltp_update_index.lua \
--mysql-user=msandbox \
--mysql_password=msandbox \
--mysql-host=127.0.0.1 \
--mysql-port=8032 \
--mysql-db=test \
--tables=1 \
--table-size=1000000 \
--threads=10 \
--events=0 \
--time=15 \
--report-interval=3 \
--db-ps-mode=disable \
run
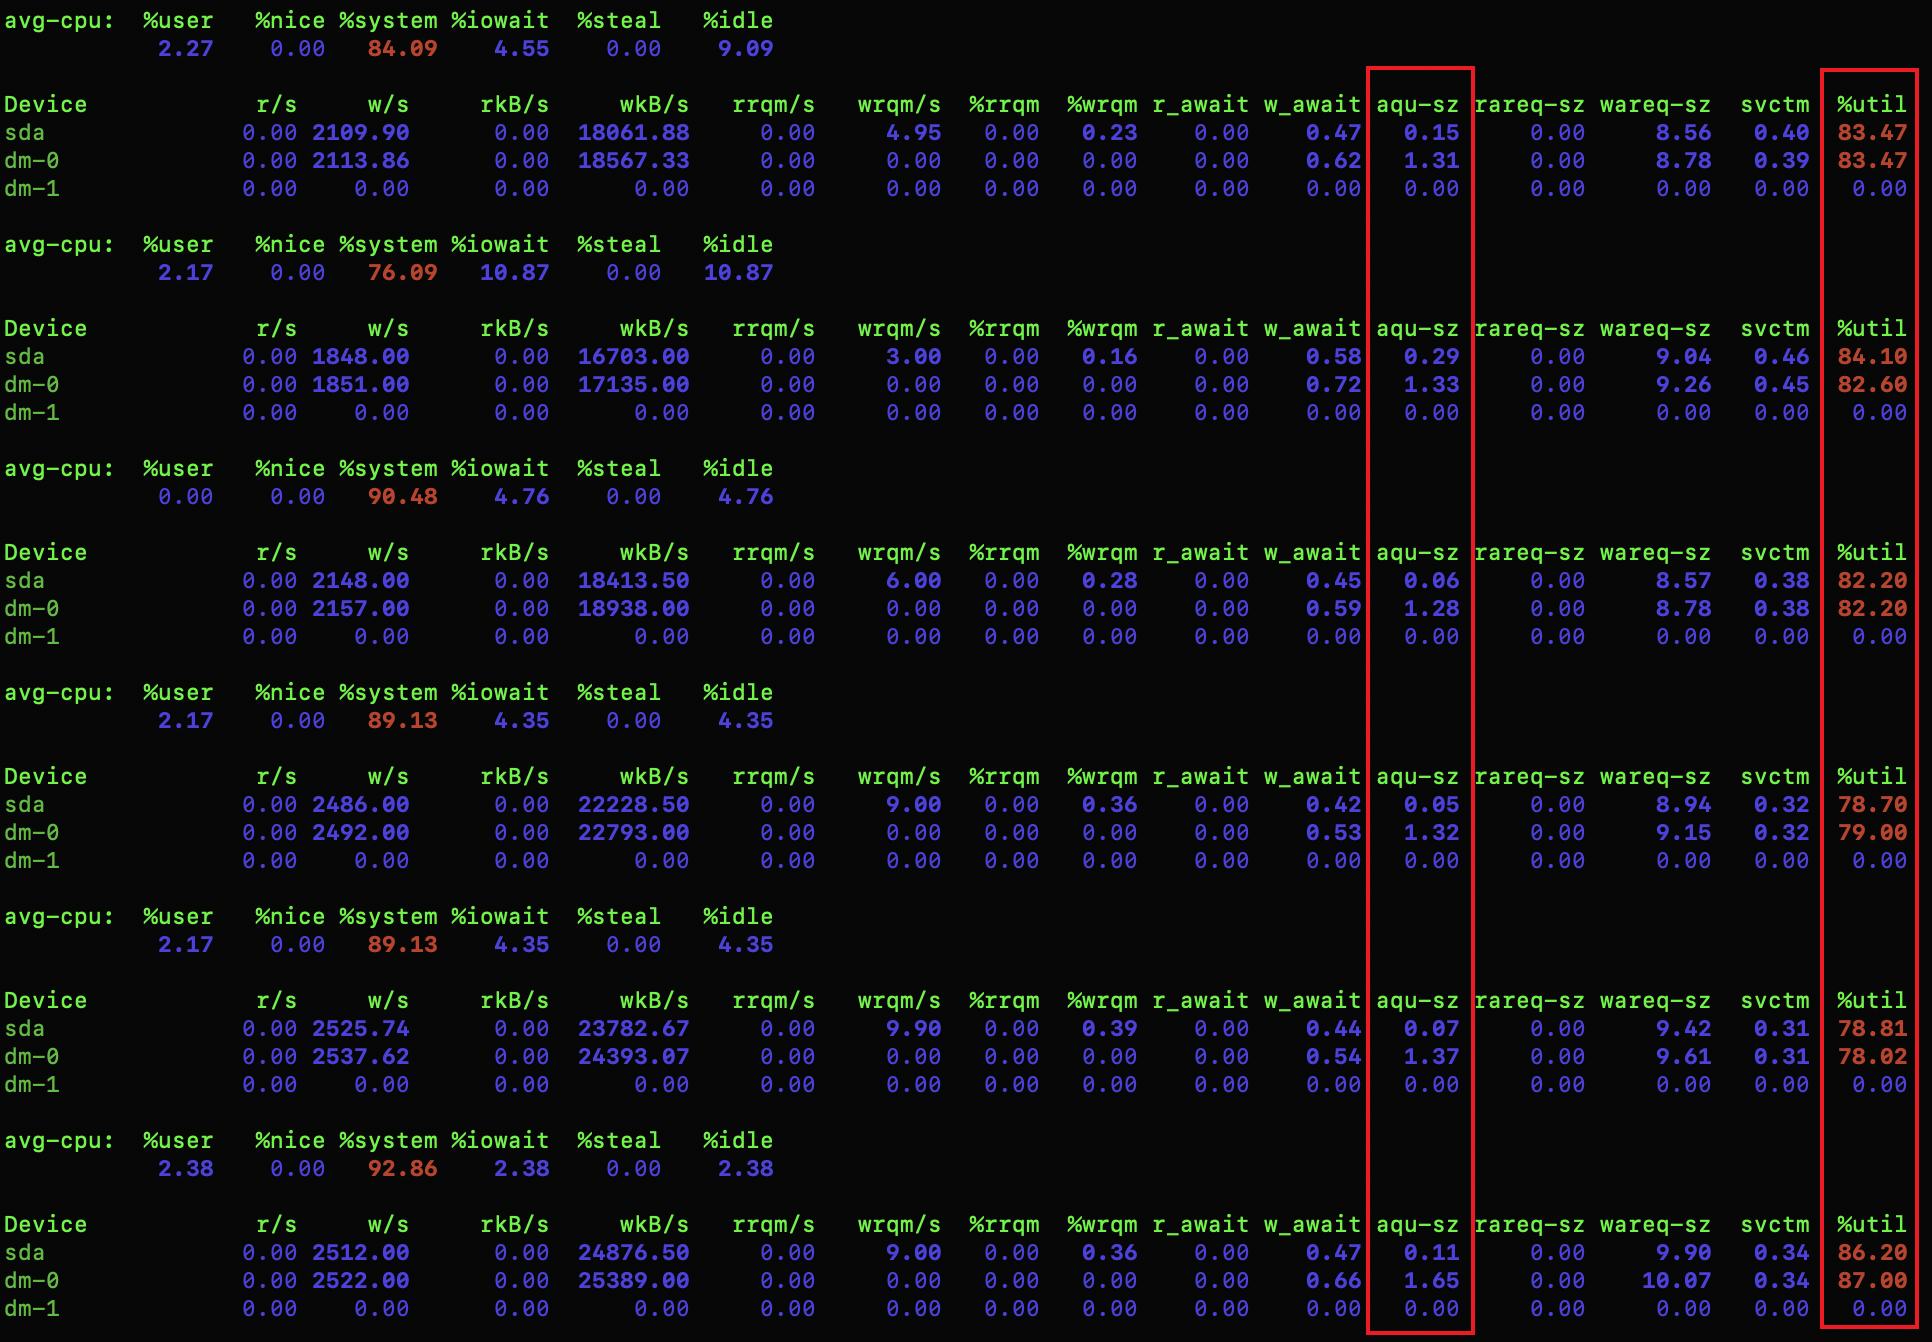
间隔查看 iostat
iostat -x 1
测试结果:
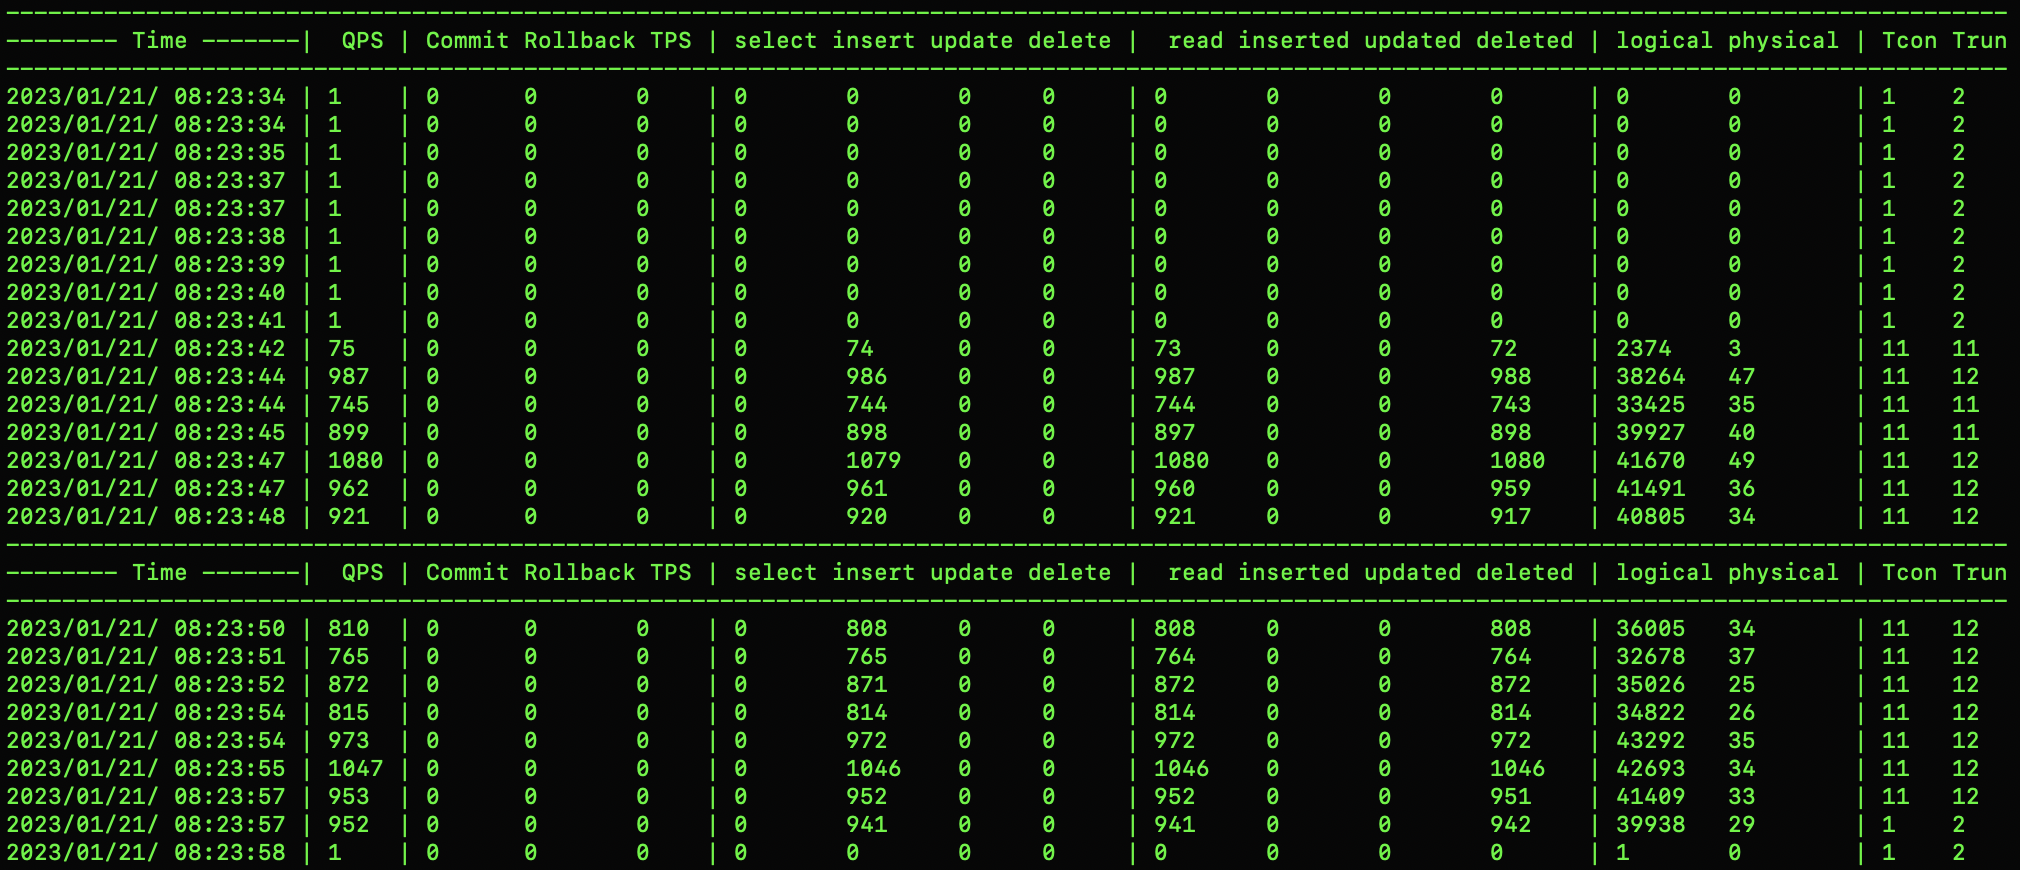
QPS info:
iostat info:
用内存模拟一下磁盘:
[root@ol8mysql01 ~]# mkdir /mnt/samdisk
[root@ol8mysql01 ~]# mount -t tmpfs -o size=1024m tmpfs /mnt/samdisk
[root@ol8mysql01 ~]# df -h
Filesystem                   Size  Used Avail Use% Mounted on
devtmpfs                     956M     0  956M   0% /dev
tmpfs                        987M     0  987M   0% /dev/shm
tmpfs                        987M   17M  970M   2% /run
tmpfs                        987M     0  987M   0% /sys/fs/cgroup
/dev/mapper/vg_main-lv_root   33G  8.1G   25G  25% /
/dev/sda1                    495M  105M  391M  22% /boot
vagrant                      466G  255G  211G  55% /vagrant
tmpfs                        198M     0  198M   0% /run/user/1000
tmpfs                        1.0G     0  1.0G   0% /mnt/samdisk
[root@ol8mysql01 ~]#
停下数据库,将数据目录移到模拟磁盘里
[root@ol8mysql01 sandboxes]# cd msb_8_0_32/
[root@ol8mysql01 msb_8_0_32]# ./stop
stop /root/sandboxes/msb_8_0_32
[root@ol8mysql01 msb_8_0_32]# mv data/ /mnt/s
samdisk/ slow/
[root@ol8mysql01 msb_8_0_32]# mv data/ /mnt/samdisk/data
[root@ol8mysql01 msb_8_0_32]# ln -s /mnt/samdisk/data/ data
[root@ol8mysql01 msb_8_0_32]# ./start
.. sandbox server started
[root@ol8mysql01 msb_8_0_32]#
跑同样符合结果:
磁盘:
[ 3s ] thds: 10 tps: 950.38 qps: 950.38 (r/w/o: 0.00/950.38/0.00) lat (ms,95%): 21.50 err/s: 0.00 reconn/s: 0.00
[ 6s ] thds: 10 tps: 840.35 qps: 840.35 (r/w/o: 0.00/840.35/0.00) lat (ms,95%): 29.72 err/s: 0.00 reconn/s: 0.00
[ 9s ] thds: 10 tps: 835.56 qps: 835.56 (r/w/o: 0.00/835.56/0.00) lat (ms,95%): 25.28 err/s: 0.00 reconn/s: 0.00
[ 12s ] thds: 10 tps: 789.20 qps: 789.20 (r/w/o: 0.00/789.20/0.00) lat (ms,95%): 28.16 err/s: 0.00 reconn/s: 0.00
[ 15s ] thds: 10 tps: 813.77 qps: 813.77 (r/w/o: 0.00/813.77/0.00) lat (ms,95%): 26.68 err/s: 0.00 reconn/s: 0.00
SQL statistics:
    queries performed:
        read:                            0
        write:                           12701
        other:                           0
        total:                           12701
    transactions:                        12701  (845.49 per sec.)
    queries:                             12701  (845.49 per sec.)
    ignored errors:                      0      (0.00 per sec.)
    reconnects:                          0      (0.00 per sec.)

General statistics:
    total time:                          15.0205s
    total number of events:              12701

Latency (ms):
         min:                                    1.49
         avg:                                   11.81
         max:                                  104.01
         95th percentile:                       26.20
         sum:                               150012.89

Threads fairness:
    events (avg/stddev):           1270.1000/36.28
    execution time (avg/stddev):   15.0013/0.01

内存磁盘:
Threads started!

[ 3s ] thds: 10 tps: 3674.61 qps: 3674.61 (r/w/o: 0.00/3674.61/0.00) lat (ms,95%): 10.27 err/s: 0.00 reconn/s: 0.00
[ 6s ] thds: 10 tps: 3475.69 qps: 3475.69 (r/w/o: 0.00/3475.69/0.00) lat (ms,95%): 11.04 err/s: 0.00 reconn/s: 0.00
[ 9s ] thds: 10 tps: 3453.81 qps: 3453.81 (r/w/o: 0.00/3453.81/0.00) lat (ms,95%): 9.91 err/s: 0.00 reconn/s: 0.00
[ 12s ] thds: 10 tps: 3154.82 qps: 3154.82 (r/w/o: 0.00/3154.82/0.00) lat (ms,95%): 11.04 err/s: 0.00 reconn/s: 0.00
SQL statistics:
    queries performed:
        read:                            0
        write:                           50532
        other:                           0
        total:                           50532
    transactions:                        50532  (3366.33 per sec.)
    queries:                             50532  (3366.33 per sec.)
    ignored errors:                      0      (0.00 per sec.)
    reconnects:                          0      (0.00 per sec.)

General statistics:
    total time:                          15.0089s
    total number of events:              50532
事务量比较:接近四倍性能差异
    transactions:                        12701  (845.49 per sec.)
    transactions:                        50532  (3366.33 per sec.)
oltp_point_select.lua
sysbench \
/usr/local/sysbench/share/sysbench/oltp_point_select.lua \
--mysql-user=msandbox \
--mysql_password=msandbox \
--mysql-host=127.0.0.1 \
--mysql-port=8032 \
--mysql-db=test \
--tables=1 \
--table-size=1000000 \
--threads=10 \
--events=0 \
--time=15 \
--report-interval=3 \
--db-ps-mode=disable \
run
select 磁盘测试: 差距不是很明显
Threads started!

[ 3s ] thds: 10 tps: 10196.67 qps: 10196.67 (r/w/o: 10196.67/0.00/0.00) lat (ms,95%): 13.46 err/s: 0.00 reconn/s: 0.00
[ 6s ] thds: 10 tps: 11252.75 qps: 11252.75 (r/w/o: 11252.75/0.00/0.00) lat (ms,95%): 13.22 err/s: 0.00 reconn/s: 0.00
[ 9s ] thds: 10 tps: 10311.76 qps: 10311.76 (r/w/o: 10311.76/0.00/0.00) lat (ms,95%): 14.21 err/s: 0.00 reconn/s: 0.00
[ 12s ] thds: 10 tps: 10674.76 qps: 10674.76 (r/w/o: 10674.76/0.00/0.00) lat (ms,95%): 13.70 err/s: 0.00 reconn/s: 0.00
[ 15s ] thds: 10 tps: 11044.01 qps: 11044.01 (r/w/o: 11044.01/0.00/0.00) lat (ms,95%): 13.22 err/s: 0.00 reconn/s: 0.00
SQL statistics:
    queries performed:
        read:                            160487
        write:                           0
        other:                           0
        total:                           160487
    transactions:                        160487 (10689.04 per sec.)
    queries:                             160487 (10689.04 per sec.)
    ignored errors:                      0      (0.00 per sec.)
    reconnects:                          0      (0.00 per sec.)

General statistics:
    total time:                          15.0122s
    total number of events:              160487

Latency (ms):
         min:                                    0.06
         avg:                                    0.93
         max:                                  206.41
         95th percentile:                       13.46
         sum:                               149730.31

Threads fairness:
    events (avg/stddev):           16048.7000/156.58
    execution time (avg/stddev):   14.9730/0.01

-----------------------------------------------------------------------------------------------------------------------------------------------
-------- Time -------|  QPS | Commit Rollback TPS | select insert update delete |  read inserted updated deleted | logical physical | Tcon Trun
-----------------------------------------------------------------------------------------------------------------------------------------------
2023/01/21/ 08:52:32 | 6547 | 0      0       0    | 6546    0       0     0     | 6546    0       0       0      | 13399   12       | 11   12
2023/01/21/ 08:52:33 | 10334| 0      0       0    | 10333   0       0     0     | 10333   0       0       0      | 21194   24       | 11   12
2023/01/21/ 08:52:35 | 9385 | 0      0       0    | 9384    0       0     0     | 9384    0       0       0      | 19209   16       | 11   11
2023/01/21/ 08:52:35 | 11878| 0      0       0    | 11877   0       0     0     | 11877   0       0       0      | 24483   20       | 11   12
2023/01/21/ 08:52:36 | 11510| 0      0       0    | 11509   0       0     0     | 11508   0       0       0      | 23508   16       | 11   12
2023/01/21/ 08:52:38 | 10993| 0      0       0    | 10992   0       0     0     | 10992   0       0       0      | 22452   15       | 11   12
2023/01/21/ 08:52:39 | 10117| 0      0       0    | 10116   0       0     0     | 10116   0       0       0      | 20748   34       | 11   12
2023/01/21/ 08:52:40 | 9993 | 0      0       0    | 9992    0       0     0     | 9992    0       0       0      | 20386   18       | 11   12
2023/01/21/ 08:52:42 | 9530 | 0      0       0    | 9529    0       0     0     | 9529    0       0       0      | 19436   13       | 11   12
2023/01/21/ 08:52:42 | 11460| 0      0       0    | 11459   0       0     0     | 11458   0       0       0      | 23359   23       | 11   12
2023/01/21/ 08:52:43 | 11363| 0      0       0    | 11362   0       0     0     | 11363   0       0       0      | 23122   13       | 11   12
2023/01/21/ 08:52:45 | 10285| 0      0       0    | 10283   0       0     0     | 10283   0       0       0      | 20919   10       | 11   12
2023/01/21/ 08:52:45 | 11118| 0      0       0    | 11118   0       0     0     | 11118   0       0       0      | 22638   17       | 11   12
2023/01/21/ 08:52:46 | 11454| 0      0       0    | 11453   0       0     0     | 11453   0       0       0      | 23306   21       | 11   12
2023/01/21/ 08:52:47 | 3423 | 0      0       0    | 3412    0       0     0     | 3412    0       0       0      | 6952    4        | 1    2
2023/01/21/ 08:52:48 | 1    | 0      0       0    | 0       0       0     0     | 0       0       0       0      | 0       0        | 1    2
select 内存测试:
Threads started!

[ 3s ] thds: 10 tps: 10134.29 qps: 10134.29 (r/w/o: 10134.29/0.00/0.00) lat (ms,95%): 13.95 err/s: 0.00 reconn/s: 0.00
[ 6s ] thds: 10 tps: 11641.66 qps: 11641.66 (r/w/o: 11641.66/0.00/0.00) lat (ms,95%): 12.98 err/s: 0.00 reconn/s: 0.00
[ 9s ] thds: 10 tps: 11881.26 qps: 11881.26 (r/w/o: 11881.26/0.00/0.00) lat (ms,95%): 12.75 err/s: 0.00 reconn/s: 0.00
[ 12s ] thds: 10 tps: 11974.97 qps: 11974.97 (r/w/o: 11974.97/0.00/0.00) lat (ms,95%): 12.98 err/s: 0.00 reconn/s: 0.00
[ 15s ] thds: 10 tps: 11661.85 qps: 11661.85 (r/w/o: 11661.85/0.00/0.00) lat (ms,95%): 12.98 err/s: 0.00 reconn/s: 0.00
SQL statistics:
    queries performed:
        read:                            171936
        write:                           0
        other:                           0
        total:                           171936
    transactions:                        171936 (11451.75 per sec.)
    queries:                             171936 (11451.75 per sec.)
    ignored errors:                      0      (0.00 per sec.)
    reconnects:                          0      (0.00 per sec.)

General statistics:
    total time:                          15.0120s
    total number of events:              171936

Latency (ms):
         min:                                    0.07
         avg:                                    0.87
         max:                                   95.34
         95th percentile:                       13.22
         sum:                               149745.73

Threads fairness:
    events (avg/stddev):           17193.6000/147.07
    execution time (avg/stddev):   14.9746/0.01

-----------------------------------------------------------------------------------------------------------------------------------------------
-------- Time -------|  QPS | Commit Rollback TPS | select insert update delete |  read inserted updated deleted | logical physical | Tcon Trun
-----------------------------------------------------------------------------------------------------------------------------------------------
2023/01/21/ 08:48:31 | 7977 | 0      0       0    | 7976    0       0     0     | 7976    0       0       0      | 16548   45       | 11   12
2023/01/21/ 08:48:32 | 10198| 0      0       0    | 10197   0       0     0     | 10197   0       0       0      | 21104   63       | 11   12
2023/01/21/ 08:48:33 | 9449 | 0      0       0    | 9448    0       0     0     | 9448    0       0       0      | 19529   52       | 11   12
2023/01/21/ 08:48:34 | 11238| 0      0       0    | 11237   0       0     0     | 11237   0       0       0      | 23166   43       | 11   11
2023/01/21/ 08:48:36 | 11929| 0      0       0    | 11928   0       0     0     | 11927   0       0       0      | 24606   50       | 11   12
2023/01/21/ 08:48:36 | 11648| 0      0       0    | 11646   0       0     0     | 11647   0       0       0      | 23973   45       | 11   12
2023/01/21/ 08:48:37 | 11987| 0      0       0    | 11987   0       0     0     | 11986   0       0       0      | 24695   55       | 11   12
2023/01/21/ 08:48:39 | 11879| 0      0       0    | 11878   0       0     0     | 11878   0       0       0      | 24407   45       | 11   12
2023/01/21/ 08:48:39 | 11988| 0      0       0    | 11987   0       0     0     | 11988   0       0       0      | 24603   46       | 11   11
2023/01/21/ 08:48:40 | 11984| 0      0       0    | 11983   0       0     0     | 11983   0       0       0      | 24556   37       | 11   11
2023/01/21/ 08:48:41 | 12164| 0      0       0    | 12162   0       0     0     | 12161   0       0       0      | 24972   43       | 11   12
2023/01/21/ 08:48:42 | 12045| 0      0       0    | 12044   0       0     0     | 12045   0       0       0      | 24745   46       | 11   12
2023/01/21/ 08:48:43 | 11806| 0      0       0    | 11806   0       0     0     | 11805   0       0       0      | 24168   31       | 11   12
2023/01/21/ 08:48:44 | 11751| 0      0       0    | 11750   0       0     0     | 11751   0       0       0      | 24063   31       | 11   11
2023/01/21/ 08:48:46 | 11707| 0      0       0    | 11706   0       0     0     | 11706   0       0       0      | 23935   20       | 11   11
2023/01/21/ 08:48:46 | 2212 | 0      0       0    | 2201    0       0     0     | 2201    0       0       0      | 4492    3        | 1    2
-----------------------------------------------------------------------------------------------------------------------------------------------
MySQL性能分析工具
tuning-primer.sh
[项目 tuning-primer.sh] (https://github.com/BMDan/tuning-primer.sh) 是mysql的另一个优化工具,针于mysql的整体进行一个体检,对潜在的问题,给出优化的建议。
Perl语言写的的工具,只要有Perl即可下载使用:
- 重要关注[!!](中括号有叹号的项)
- 关注最后给的建议Recommendations
[root@ol8mysql01 MySQLTuner-perl]# ./mysqltuner.pl -help
Name:
     MySQLTuner 2.0.10 - MySQL High Performance Tuning Script

Important Usage Guidelines:
    To run the script with the default options, run the script without
    arguments Allow MySQL server to run for at least 24-48 hours before
    trusting suggestions Some routines may require root level privileges
    (script will provide warnings) You must provide the remote server's
    total memory when connecting to other servers

Connection and Authentication:
     --host <hostname>           Connect to a remote host to perform tests (default: localhost)
     --socket <socket>           Use a different socket for a local connection
     --port <port>               Port to use for connection (default: 3306)
     --protocol tcp              Force TCP connection instead of socket
     --user <username>           Username to use for authentication
     --userenv <envvar>          Name of env variable which contains username to use for authentication
     --pass <password>           Password to use for authentication
     --passenv <envvar>          Name of env variable which contains password to use for authentication
     --ssl-ca <path>             Path to public key
     --mysqladmin <path>         Path to a custom mysqladmin executable
     --mysqlcmd <path>           Path to a custom mysql executable
     --defaults-file <path>      Path to a custom .my.cnf
     --defaults-extra-file <path>      Path to a extra custom config file
     --server-log <path>         Path to explicit log file (error_log)

Performance and Reporting Options:
     --skipsize                  Don't enumerate tables and their types/sizes (default: on)
                                 (Recommended for servers with many tables)
     --json                      Print result as JSON string
     --prettyjson                Print result as JSON formatted string
     --skippassword              Don't perform checks on user passwords (default: off)
     --checkversion              Check for updates to MySQLTuner (default: don't check)
     --updateversion             Check for updates to MySQLTuner and update when newer version is available (default: don't check)
     --forcemem <size>           Amount of RAM installed in megabytes
     --forceswap <size>          Amount of swap memory configured in megabytes
     --passwordfile <path>       Path to a password file list (one password by line)
     --cvefile <path>            CVE File for vulnerability checks
     --outputfile <path>         Path to a output txt file
     --reportfile <path>         Path to a report txt file
     --template   <path>         Path to a template file

Output Options:
     --silent                    Don't output anything on screen
     --verbose                   Print out all options (default: no verbose, dbstat, idxstat, sysstat, tbstat, pfstat)
     --nocolor                   Don't print output in color
     --nogood                    Remove OK responses
     --nobad                     Remove negative/suggestion responses
     --noinfo                    Remove informational responses
     --debug                     Print debug information
     --noprocess                 Consider no other process is running
     --dbstat                    Print database information
     --nodbstat                  Don't print database information
     --tbstat                    Print table information
     --notbstat                  Don't print table information
     --colstat                   Print column information
     --nocolstat                 Don't print column information
     --idxstat                   Print index information
     --noidxstat                 Don't print index information
     --sysstat                   Print system information
     --nosysstat                 Don't print system information
     --pfstat                    Print Performance schema
     --nopfstat                  Don't print Performance schema
     --bannedports               Ports banned separated by comma (,)
     --server-log                Define specific error_log to analyze
     --maxportallowed            Number of open ports allowable on this host
     --buffers                   Print global and per-thread buffer values

[root@ol8mysql01 MySQLTuner-perl]#
[root@ol8mysql01 MySQLTuner-perl]# ./mysqltuner.pl --socket /tmp/mysql_sandbox8032.sock --user root -pass msandbox
 >>  MySQLTuner 2.0.10
	 * Jean-Marie Renouard <jmrenouard@gmail.com>
	 * Major Hayden <major@mhtx.net>
 >>  Bug reports, feature requests, and downloads at http://mysqltuner.pl/
 >>  Run with '--help' for additional options and output filtering

[--] Skipped version check for MySQLTuner script
Please enter your MySQL administrative login: root
Please enter your MySQL administrative password: [OK] Currently running supported MySQL version 8.0.32
[OK] Operating on 64-bit architecture

-------- Log file Recommendations ------------------------------------------------------------------
[OK] Log file /root/sandboxes/msb_8_0_32/data/msandbox.err exists
[--] Log file: /root/sandboxes/msb_8_0_32/data/msandbox.err (5K)
[OK] Log file /root/sandboxes/msb_8_0_32/data/msandbox.err is not empty
[OK] Log file /root/sandboxes/msb_8_0_32/data/msandbox.err is smaller than 32 Mb
[OK] Log file /root/sandboxes/msb_8_0_32/data/msandbox.err is readable.
[!!] /root/sandboxes/msb_8_0_32/data/msandbox.err contains 13 warning(s).
[OK] /root/sandboxes/msb_8_0_32/data/msandbox.err doesn't contain any error.
[--] 6 start(s) detected in /root/sandboxes/msb_8_0_32/data/msandbox.err
[--] 1) 2023-01-21T08:51:07.520646Z 0 [System] [MY-010931] [Server] /opt/mysql/8.0.32/bin/mysqld: ready for connections. Version: '8.0.32'  socket: '/tmp/mysql_sandbox8032.sock'  port: 8032  MySQL Community Server - GPL.
[--] 2) 2023-01-21T08:51:07.520258Z 0 [System] [MY-011323] [Server] X Plugin ready for connections. Bind-address: '::' port: 18033, socket: /tmp/mysqlx-18033.sock
[--] 3) 2023-01-21T08:40:20.967980Z 0 [System] [MY-010931] [Server] /opt/mysql/8.0.32/bin/mysqld: ready for connections. Version: '8.0.32'  socket: '/tmp/mysql_sandbox8032.sock'  port: 8032  MySQL Community Server - GPL.
[--] 4) 2023-01-21T08:40:20.967890Z 0 [System] [MY-011323] [Server] X Plugin ready for connections. Bind-address: '::' port: 18033, socket: /tmp/mysqlx-18033.sock
[--] 5) 2023-01-21T08:00:52.435646Z 0 [System] [MY-010931] [Server] /opt/mysql/8.0.32/bin/mysqld: ready for connections. Version: '8.0.32'  socket: '/tmp/mysql_sandbox8032.sock'  port: 8032  MySQL Community Server - GPL.
[--] 6) 2023-01-21T08:00:52.435544Z 0 [System] [MY-011323] [Server] X Plugin ready for connections. Bind-address: '::' port: 18033, socket: /tmp/mysqlx-18033.sock
[--] 2 shutdown(s) detected in /root/sandboxes/msb_8_0_32/data/msandbox.err
[--] 1) 2023-01-21T08:50:33.882325Z 0 [System] [MY-010910] [Server] /opt/mysql/8.0.32/bin/mysqld: Shutdown complete (mysqld 8.0.32)  MySQL Community Server - GPL.
[--] 2) 2023-01-21T08:39:44.040915Z 0 [System] [MY-010910] [Server] /opt/mysql/8.0.32/bin/mysqld: Shutdown complete (mysqld 8.0.32)  MySQL Community Server - GPL.

-------- Storage Engine Statistics -----------------------------------------------------------------
[--] Status: +ARCHIVE +BLACKHOLE +CSV -FEDERATED +InnoDB +MEMORY +MRG_MYISAM +MyISAM -ndbcluster -ndbinfo +PERFORMANCE_SCHEMA
[--] Data in InnoDB tables: 238.8M (Tables: 2)
[OK] Total fragmented tables: 0

-------- Analysis Performance Metrics --------------------------------------------------------------
[--] innodb_stats_on_metadata: OFF
[OK] No stat updates during querying INFORMATION_SCHEMA.

-------- Views Metrics -----------------------------------------------------------------------------

-------- Triggers Metrics --------------------------------------------------------------------------

-------- Routines Metrics --------------------------------------------------------------------------

-------- Security Recommendations ------------------------------------------------------------------
[--] Skipped due to unsupported feature for MySQL 8

-------- CVE Security Recommendations --------------------------------------------------------------
[OK] NO SECURITY CVE FOUND FOR YOUR VERSION

-------- Performance Metrics -----------------------------------------------------------------------
[--] Up for: 2d 6h 2m 48s (500K q [2.570 qps], 49 conn, TX: 309M, RX: 20M)
[--] Reads / Writes: 100% / 0%
[--] Binary logging is enabled (GTID MODE: ON)
[--] Physical Memory     : 1.9G
[--] Max MySQL memory    : 10.1G
[--] Other process memory: 0B
[--] Total buffers: 168.0M global + 65.9M per thread (151 max threads)
[--] Performance_schema Max memory usage: 227M
[--] Galera GCache Max memory usage: 0B
[OK] Maximum reached memory usage: 1.1G (56.79% of installed RAM)
[!!] Maximum possible memory usage: 10.1G (524.27% of installed RAM)
[!!] Overall possible memory usage with other process exceeded memory
[OK] Slow queries: 0% (0/500K)
[OK] Highest usage of available connections: 7% (11/151)
[!!] Aborted connections: 10.20% (5/49)
[--] Query cache has been removed since MySQL 8.0
[OK] No Sort requiring temporary tables
[OK] No joins without indexes
[OK] Temporary tables created on disk: 0% (0 on disk / 14K total)
[OK] Thread cache hit rate: 73% (13 created / 49 connections)
[OK] Table cache hit rate: 99% (503K hits / 503K requests)
[OK] table_definition_cache (2000) is greater than number of tables (330)
[OK] Open file limit used: 0% (2/8K)
[OK] Table locks acquired immediately: 100% (14K immediate / 14K locks)
[OK] Binlog cache memory access: 0% (0 Memory / 0 Total)

-------- Performance schema ------------------------------------------------------------------------
[--] Performance_schema is activated.
[--] Memory used by Performance_schema: 227.7M
[--] Sys schema is installed.

-------- ThreadPool Metrics ------------------------------------------------------------------------
[--] ThreadPool stat is disabled.

-------- MyISAM Metrics ----------------------------------------------------------------------------
[--] MyISAM Metrics are disabled since MySQL 8.0.

-------- InnoDB Metrics ----------------------------------------------------------------------------
[--] InnoDB is enabled.
[--] InnoDB Thread Concurrency: 0
[OK] InnoDB File per table is activated
[!!] InnoDB buffer pool / data size: 128.0M / 238.8M
[!!] Ratio InnoDB log file size / InnoDB Buffer pool size (75%): 48.0M * 2 / 128.0M should be equal to 25%
[OK] InnoDB buffer pool instances: 1
[--] Number of InnoDB Buffer Pool Chunk: 1 for 1 Buffer Pool Instance(s)
[OK] Innodb_buffer_pool_size aligned with Innodb_buffer_pool_chunk_size & Innodb_buffer_pool_instances
[OK] InnoDB Read buffer efficiency: 99.27% (1048051 hits / 1055727 total)
[OK] InnoDB Write log efficiency: 97.12% (909 hits / 936 total)
[OK] InnoDB log waits: 0.00% (0 waits / 27 writes)

-------- Aria Metrics ------------------------------------------------------------------------------
[--] Aria Storage Engine not available.

-------- TokuDB Metrics ----------------------------------------------------------------------------
[--] TokuDB is disabled.

-------- XtraDB Metrics ----------------------------------------------------------------------------
[--] XtraDB is disabled.

-------- Galera Metrics ----------------------------------------------------------------------------
[--] Galera is disabled.

-------- Replication Metrics -----------------------------------------------------------------------
[--] Galera Synchronous replication: NO
[--] No replication slave(s) for this server.
[--] Binlog format: ROW
[--] XA support enabled: ON
[--] Semi synchronous replication Master: Not Activated
[--] Semi synchronous replication Slave: Not Activated
[--] This is a standalone server

-------- Recommendations ---------------------------------------------------------------------------
General recommendations:
    Check warning line(s) in /root/sandboxes/msb_8_0_32/data/msandbox.err file
    Reduce your overall MySQL memory footprint for system stability
    Dedicate this server to your database for highest performance.
    Reduce or eliminate unclosed connections and network issues
    Buffer Key MyISAM set to 0, no MyISAM table detected
    Before changing innodb_log_file_size and/or innodb_log_files_in_group read this: https://bit.ly/2TcGgtU
Variables to adjust:
  *** MySQL's maximum memory usage is dangerously high ***
  *** Add RAM before increasing MySQL buffer variables ***
    key_buffer_size=0
    innodb_buffer_pool_size (>= 238.8M) if possible.
    innodb_log_file_size should be (=16M) if possible, so InnoDB total log files size equals 25% of buffer pool size.
[root@ol8mysql01 MySQLTuner-perl]#
tuning-primer.sh
tuning-primer.sh 是mysql的另一个优化工具,
针于mysql的整体进行一个体检,对潜在的问题,给出优化的建议
重点查看有红色告警的选项,根据建议结合自己系统的实际情况进行修改
此工具没有更新,有些建议比较“古老”,参考使用即可
# dnf install bc
# wget https://launchpad.net/mysql-tuning-primer/trunk/1.6-r1/+download/tuning-primer.sh

下载地址:https://launchpad.net/mysql-tuning-primer/
使用方法:将tuning-primer.sh拷贝到my.cnf的同级目录执行:

my.cnf需要配置好正确帐号/密码/socket信息


[root@ol8mysql01 ~]# cat .my.cnf
[client]
user=root
password=msandbox
socket=/tmp/mysql_sandbox8032.sock
[root@ol8mysql01 ~]# sh tuning-primer.sh

	-- MYSQL PERFORMANCE TUNING PRIMER --
	     - By: Matthew Montgomery -

MySQL Version 8.0.32 x86_64

Uptime = 2 days 6 hrs 46 min 59 sec
Avg. qps = 2
Total Questions = 500955
Threads Connected = 1

Server has been running for over 48hrs.
It should be safe to follow these recommendations

To find out more information on how each of these
runtime variables effects performance visit:
http://dev.mysql.com/doc/refman/8.0/en/server-system-variables.html
Visit http://www.mysql.com/products/enterprise/advisors.html
for info about MySQL's Enterprise Monitoring and Advisory Service

SLOW QUERIES
The slow query log is NOT enabled.
Current long_query_time = 10.000000 sec.
You have 0 out of 500976 that take longer than 10.000000 sec. to complete
Your long_query_time seems to be fine

BINARY UPDATE LOG
The binary update log is enabled
The expire_logs_days is not set.
The mysqld will retain the entire binary log until RESET MASTER or PURGE MASTER LOGS commands are run manually
Setting expire_logs_days will allow you to remove old binary logs automatically
See http://dev.mysql.com/doc/refman/8.0/en/purge-master-logs.html

WORKER THREADS
Current thread_cache_size = 9
Current threads_cached = 8
Current threads_per_sec = 0
Historic threads_per_sec = 0
Your thread_cache_size is fine

MAX CONNECTIONS
Current max_connections = 151
Current threads_connected = 1
Historic max_used_connections = 11
The number of used connections is 7% of the configured maximum.
You are using less than 10% of your configured max_connections.
Lowering max_connections could help to avoid an over-allocation of memory
See "MEMORY USAGE" section to make sure you are not over-allocating

No InnoDB Support Enabled!

MEMORY USAGE
Max Memory Ever Allocated : 172 M
Configured Max Per-thread Buffers : 287 M
Configured Max Global Buffers : 152 M
Configured Max Memory Limit : 439 M
Physical Memory : 1.92 G
Max memory limit seem to be within acceptable norms

KEY BUFFER
No key reads?!
Seriously look into using some indexes
Current MyISAM index space = 0 bytes
Current key_buffer_size = 8 M
Key cache miss rate is 1 : 0
Key buffer free ratio = 81 %
Your key_buffer_size seems to be fine

QUERY CACHE
You are using MySQL 8.0.32, no query cache is supported.
I recommend an upgrade to MySQL 4.1 or better

SORT OPERATIONS
Current sort_buffer_size = 256 K
Current read_rnd_buffer_size = 256 K
Sort buffer seems to be fine

JOINS
Current join_buffer_size = 260.00 K
You have had 14 queries where a join could not use an index properly
You should enable "log-queries-not-using-indexes"
Then look for non indexed joins in the slow query log.
If you are unable to optimize your queries you may want to increase your
join_buffer_size to accommodate larger joins in one pass.

Note! This script will still suggest raising the join_buffer_size when
ANY joins not using indexes are found.

OPEN FILES LIMIT
Current open_files_limit = 8161 files
The open_files_limit should typically be set to at least 2x-3x
that of table_cache if you have heavy MyISAM usage.
Your open_files_limit value seems to be fine

TABLE CACHE
Current table_open_cache = 4000 tables
Current table_definition_cache = 2000 tables
You have a total of 151 tables
You have 1068 open tables.
The table_cache value seems to be fine

TEMP TABLES
Current max_heap_table_size = 16 M
Current tmp_table_size = 16 M
Of 14606 temp tables, 0% were created on disk
Created disk tmp tables ratio seems fine

TABLE SCANS
Current read_buffer_size = 128 K
Current table scan ratio = 29 : 1
read_buffer_size seems to be fine

TABLE LOCKING
Current Lock Wait ratio = 0 : 501162
Your table locking seems to be fine

[root@ol8mysql01 ~]#
pt工具集
pt-variable-advisor 可以分析MySQL变量并就可能出现的问题提出建议。
诊断参数设置是否合理。
[root@ol8mysql01 ~]# pt-
pt-align                  pt-fifo-split             pt-ioprofile              pt-mongodb-summary        pt-secure-collect         pt-stalk                  pt-variable-advisor
pt-archiver               pt-find                   pt-k8s-debug-collector    pt-mysql-summary          pt-show-grants            pt-summary                pt-visual-explain
pt-config-diff            pt-fingerprint            pt-kill                   pt-online-schema-change   pt-sift                   pt-table-checksum
pt-deadlock-logger        pt-fk-error-logger        pt-mext                   pt-pg-summary             pt-slave-delay            pt-table-sync
pt-diskstats              pt-heartbeat              pt-mongodb-index-check    pt-pmp                    pt-slave-find             pt-table-usage
pt-duplicate-key-checker  pt-index-usage            pt-mongodb-query-digest   pt-query-digest           pt-slave-restart          pt-upgrade
[root@ol8mysql01 ~]#
示例命令:
# pt-variable-advisor -help
# pt-variable-advisor localhost --socket /tmp/mysql_sandbox8032.sock
参数: 重点关注有WARN的信息的条目
[root@ol8mysql01 ~]# pt-variable-advisor localhost --socket /tmp/mysql_sandbox8032.sock

# A software update is available:
# WARN delay_key_write: MyISAM index blocks are never flushed until necessary.

# WARN key_buffer_size: The key buffer size is set to its default value, which is not good  for most production systems.

# NOTE port: The server is listening on a non-default port.

# NOTE sort_buffer_size-1: The sort_buffer_size variable should generally be left at its default unless an expert determines it is necessary to change it.

# WARN expire_logs_days: Binary logs are enabled, but automatic purging is not enabled.

# NOTE innodb_data_file_path: Auto-extending InnoDB files can consume a lot of disk space that is very difficult to reclaim later.

# NOTE innodb_flush_method: Most production database servers that use InnoDB should set innodb_flush_method to O_DIRECT to avoid double-buffering, unless the I/O system is very low performance.

# WARN myisam_recover_options: myisam_recover_options should be set to some value such as BACKUP,FORCE to ensure that table corruption is noticed.

[root@ol8mysql01 ~]#
另外 pt-query-digest 主要功能是从日志、进程列表和tcpdump分析MySQL查询。
-- 直接分析慢日志
# pt-query-digest ol8mysql-slow.log
-- 分析最近12小时慢日志
# pt-query-digest --since=12h ol8mysql-slow.log > last_12h_slow_report.log
-- 指定时间范围分析慢日志
# pt-query-digest --since '2023-01-04 09:00:00' --until '2023-01-04 12:00:00' ol8mysql-slow.log
-- 分析指含有select语句的慢查询
# pt-query-digest --filter '$event->{fingerprint} =~ m/^select/i' ol8mysql-slow.log > select_slow_report.log
-- 分析针对某个用户的慢查询
# pt-query-digest --filter '($event->{user} || "") =~ m/^root/i' ol8mysql-slow.log > root_slow_report.log
-- 查询所有所有的全表扫描或full join的慢查询
# pt-query-digest --filter '(($event->{Full_scan} || "") eq "yes") ||(($event->{Full_join} || "") eq "yes")' ol8mysql-slow.log > full_scan_slow_report.log
分析慢日志
[root@ol8mysql mysql]# pt-query-digest ol8mysql-slow.log

# 310ms user time, 30ms system time, 40.10M rss, 111.59M vsz
# Current date: Mon Jan 23 15:50:50 2023
# Hostname: ol8mysql
# Files: ol8mysql-slow.log
# Overall: 599 total, 33 unique, 0.00 QPS, 0.00x concurrency _____________
# Time range: 2023-01-04T10:41:01 to 2023-01-23T15:37:05
# Attribute          total     min     max     avg     95%  stddev  median
# ============     ======= ======= ======= ======= ======= ======= =======
# Exec time           155s    88us     51s   259ms    23ms      3s   260us
# Lock time           103s       0     51s   171ms   541us      3s       0
# Rows sent          3.91M       0 976.56k   6.69k    1.96  78.38k    0.99
# Rows examine       4.03M       0 976.56k   6.89k   27.38  78.46k    0.99
# Query size         5.92M      11 595.74k  10.12k  313.99  75.59k  192.76

# Profile
# Rank Query ID                       Response time  Calls R/Call  V/M   I
# ==== ============================== ============== ===== ======= ===== =
#    1 0xDDF2893FCAF5A8E62FA1C4BCB... 102.0871 65.9%     3 34.0290 15.79 UPDATE t?
#    2 0x98754635E4A2BD0A62C7F17FE...  33.0271 21.3%     2 16.5136 21.35 CALL insert_emp
#    3 0xE3C753C2F267B2D767A347A28...  12.8964  8.3%    16  0.8060  2.56 SELECT sbtest
# MISC 0xMISC                           6.9999  4.5%   578  0.0121   0.0 <30 ITEMS>

# Query 1: 0.02 QPS, 0.62x concurrency, ID 0xDDF2893FCAF5A8E62FA1C4BCB1845728 at byte 6110393
# This item is included in the report because it matches --limit.
# Scores: V/M = 15.79
# Time range: 2023-01-06T13:54:57 to 2023-01-06T13:57:41
# Attribute    pct   total     min     max     avg     95%  stddev  median
# ============ === ======= ======= ======= ======= ======= ======= =======
# Count          0       3
# Exec time     65    102s     4ms     51s     34s     49s     23s     49s
# Lock time     99    102s   161us     51s     34s     49s     23s     49s
# Rows sent      0       0       0       0       0       0       0       0
# Rows examine   0       2       0       2    0.67    1.96    0.93       0
# Query size     0     118      39      40   39.33   38.53       0   38.53
# String:
# Databases    test
# Hosts        localhost
# Users        root
# Query_time distribution
#   1us
#  10us
# 100us
#   1ms  ################################
#  10ms
# 100ms
#    1s
#  10s+  ################################################################
# Tables
#    SHOW TABLE STATUS FROM `test` LIKE 't1'\G
#    SHOW CREATE TABLE `test`.`t1`\G
update t1 set name='test011' where id=1\G
# Converted for EXPLAIN
# EXPLAIN /*!50100 PARTITIONS*/
select  name='test011' from t1 where  id=1\G

# Query 2: 0.01 QPS, 0.24x concurrency, ID 0x98754635E4A2BD0A62C7F17FEBCDF619 at byte 6322275
# This item is included in the report because it matches --limit.
# Scores: V/M = 21.35
# Time range: 2023-01-12T10:35:27 to 2023-01-12T10:37:42
# Attribute    pct   total     min     max     avg     95%  stddev  median
# ============ === ======= ======= ======= ======= ======= ======= =======
# Count          0       2
# Exec time     21     33s      3s     30s     17s     30s     19s     17s
# Lock time      0   219us    62us   157us   109us   157us    67us   109us
# Rows sent      0       0       0       0       0       0       0       0
# Rows examine   0       0       0       0       0       0       0       0
# Query size     0      49      24      25   24.50      25    0.71   24.50
# String:
# Databases    test
# Hosts        localhost
# Users        root
# Query_time distribution
#   1us
#  10us
# 100us
#   1ms
#  10ms
# 100ms
#    1s  ################################################################
#  10s+  ################################################################
call insert_emp(0,500000)\G

# Query 3: 0.00 QPS, 0.00x concurrency, ID 0xE3C753C2F267B2D767A347A2812914DF at byte 6271943
# This item is included in the report because it matches --limit.
# Scores: V/M = 2.56
# Time range: 2023-01-06T14:11:17 to 2023-01-12T09:16:20
# Attribute    pct   total     min     max     avg     95%  stddev  median
# ============ === ======= ======= ======= ======= ======= ======= =======
# Count          2      16
# Exec time      8     13s    88us      5s   806ms      2s      1s   445us
# Lock time      0     3ms       0     2ms   182us    93us   557us    47us
# Rows sent     99   3.91M       2 976.56k 250.25k 961.27k 413.39k    5.75
# Rows examine  96   3.91M       2 976.56k 250.25k 961.27k 413.39k    5.75
# Query size     0     751      43      51   46.94   49.17    2.83   46.83
# String:
# Databases    test (7/43%), sys (5/31%), sbtest (4/25%)
# Hosts        localhost
# Users        root
# Query_time distribution
#   1us
#  10us  ########
# 100us  ################################################################
#   1ms  ################
#  10ms
# 100ms  ########
#    1s  ################################
#  10s+
# Tables
#    SHOW TABLE STATUS FROM `sbtest` LIKE 'sbtest'\G
#    SHOW CREATE TABLE `sbtest`.`sbtest`\G
SELECT /*!40001 SQL_NO_CACHE */ * FROM `sbtest`\G
# Converted for EXPLAIN
# EXPLAIN /*!50100 PARTITIONS*/
SELECT /*!40001 SQL_NO_CACHE */ * FROM `sbtest`\G
[root@ol8mysql mysql]#
Prometheus+Grafana监控MySQL
比较远久的工具 Cacti
Cacti 一套基于PHP,MySQL,SNMP及RRDTool开发的网络流量监测图形分析工具。它通过snmpget来获取数据,使用 RRDtool绘画图形,而且你完全可以不需要了解RRDtool复杂的参数。它提供了非常强大的数据和用户管理功能,可以指定每一个用户能查看树状结 构、host以及任何一张图,还可以与LDAP结合进行用户验证,同时也能自己增加模板,功能非常强大完善,界面友好
# dnf install cacti
现在主流: Prometheus+Grafana监控MySQL
- Prometheus(由go语言(golang)开发)是一套开源的监控&报警&时间序列数据库的组合。适合监控docker容器。 因为kubernetes(俗称k8s)的流行带动了prometheus的发展。被很多人称为下一代监控系统。
- Grafana是一个开源的图表可视化系统,简单说图表配置比较方便、生成的图表比较漂亮,并能实现报警。支持五十多种数据源,Prometheus就是其中支持的一种。
[Prometheus+Grafana监控MySQL](https://www.cnblogs.com/easydb/p/14151866.html)
Prometheus: 192.168.56.120
Target : 192.168.56.130
# 下载:
https://prometheus.io/download/
- 2023/1 最新版 prometheus-2.41.0.linux-amd64.tar.gz
# 解压安装包
tar -xf prometheus-2.41.0.linux-amd64.tar.gz -C /opt
# 创建链接目录
cd /opt
ln -s prometheus-2.41.0.linux-amd64 prometheus
# 直接使用默认配置文件启动
/opt/prometheus/prometheus --config.file="/opt/prometheus/prometheus.yml" &
# 确认是否正常启动(默认端口9090)
netstat -lnptu | grep 9090
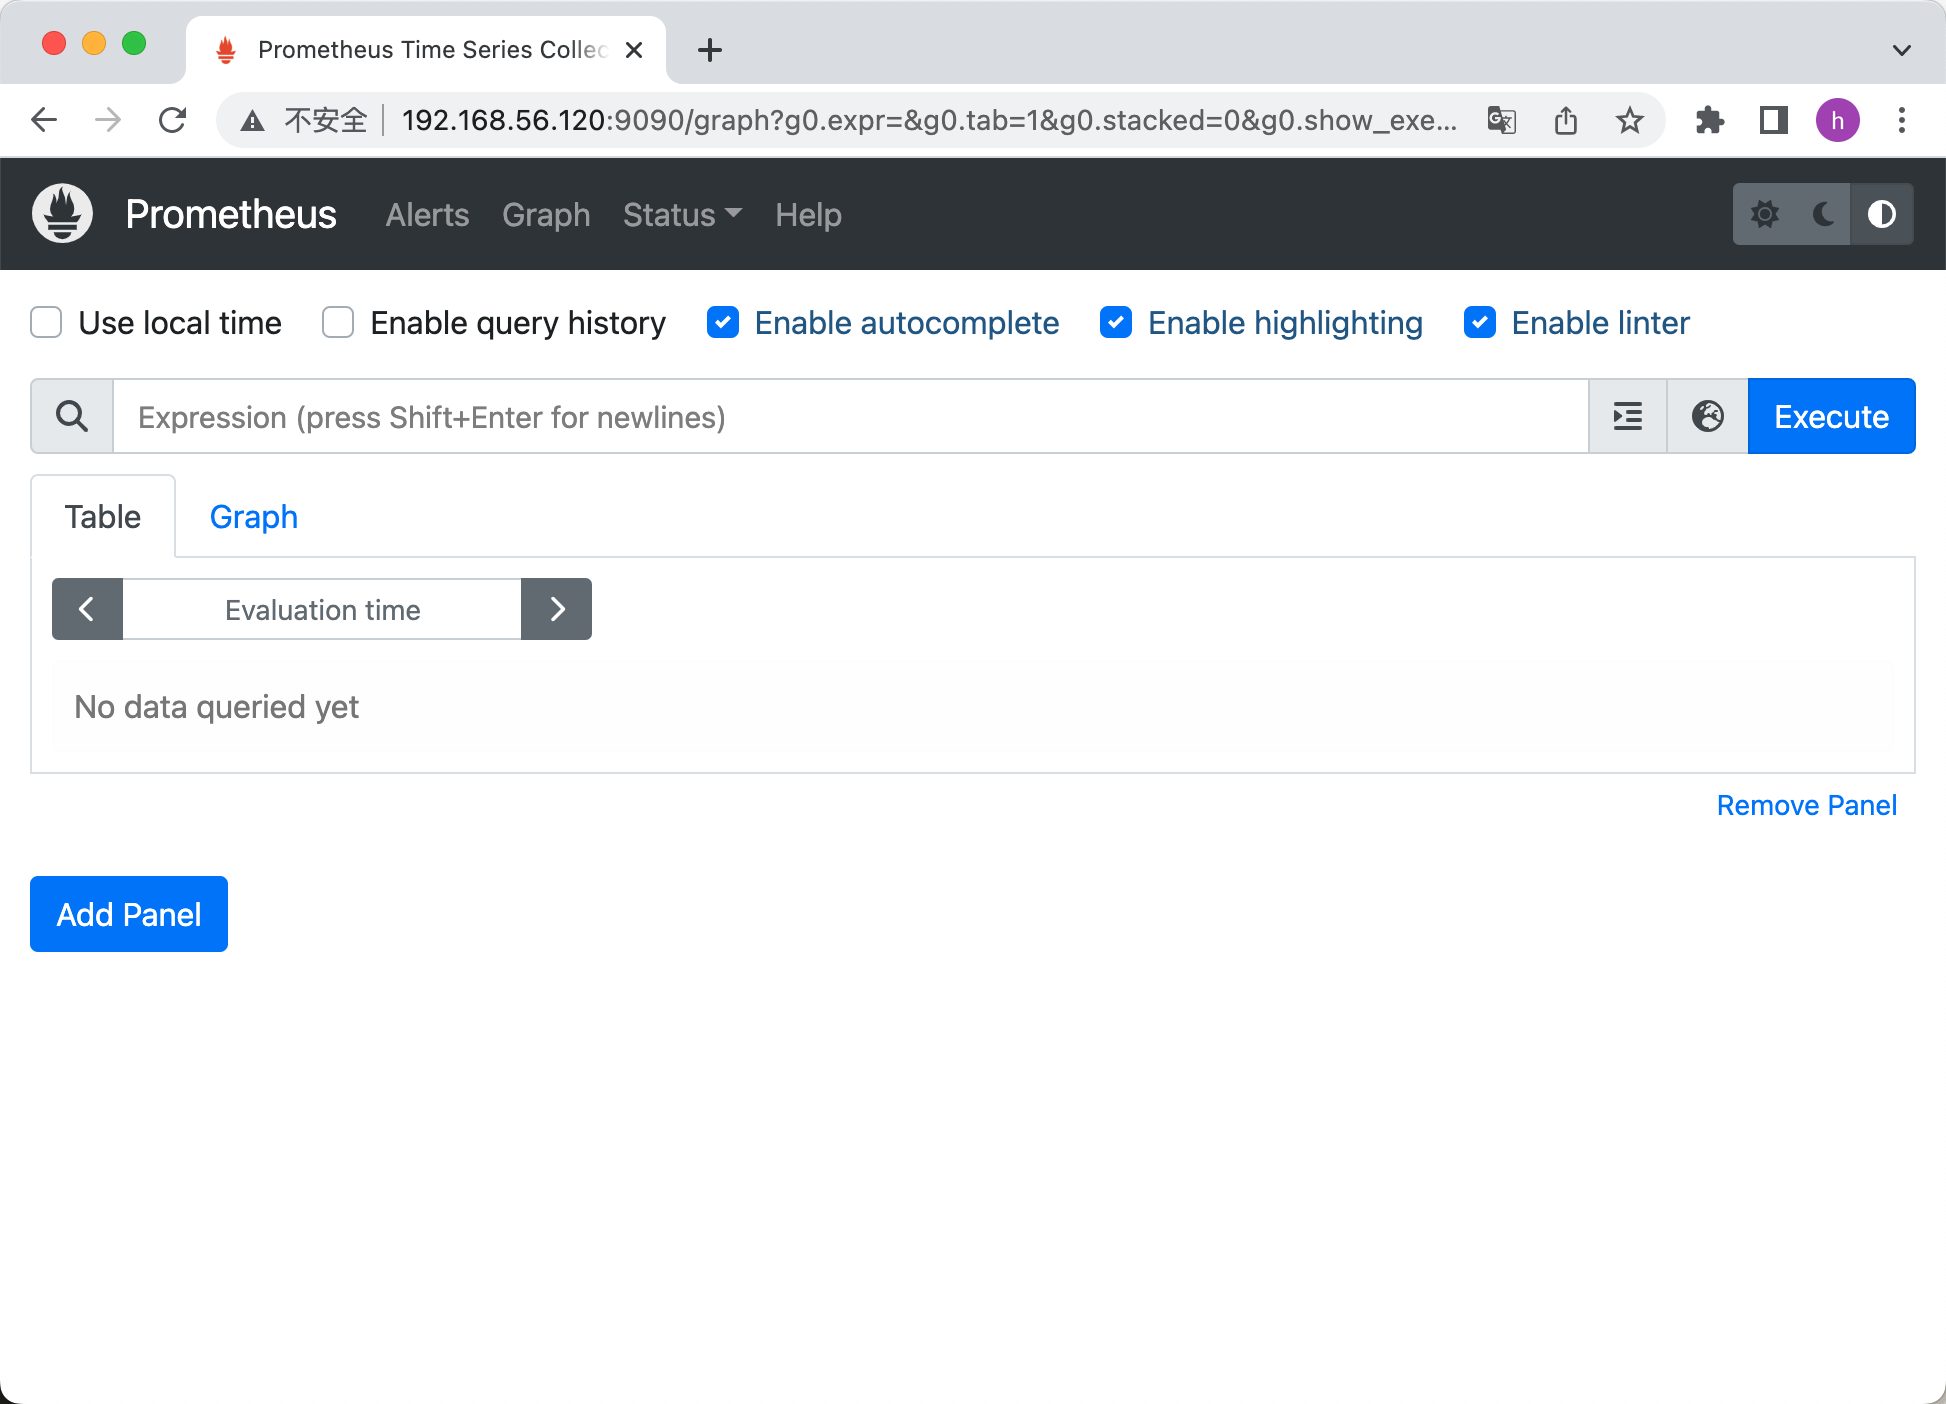
# 通过浏览器访问http://服务器IP:9090 就可以访问到prometheus的主界面
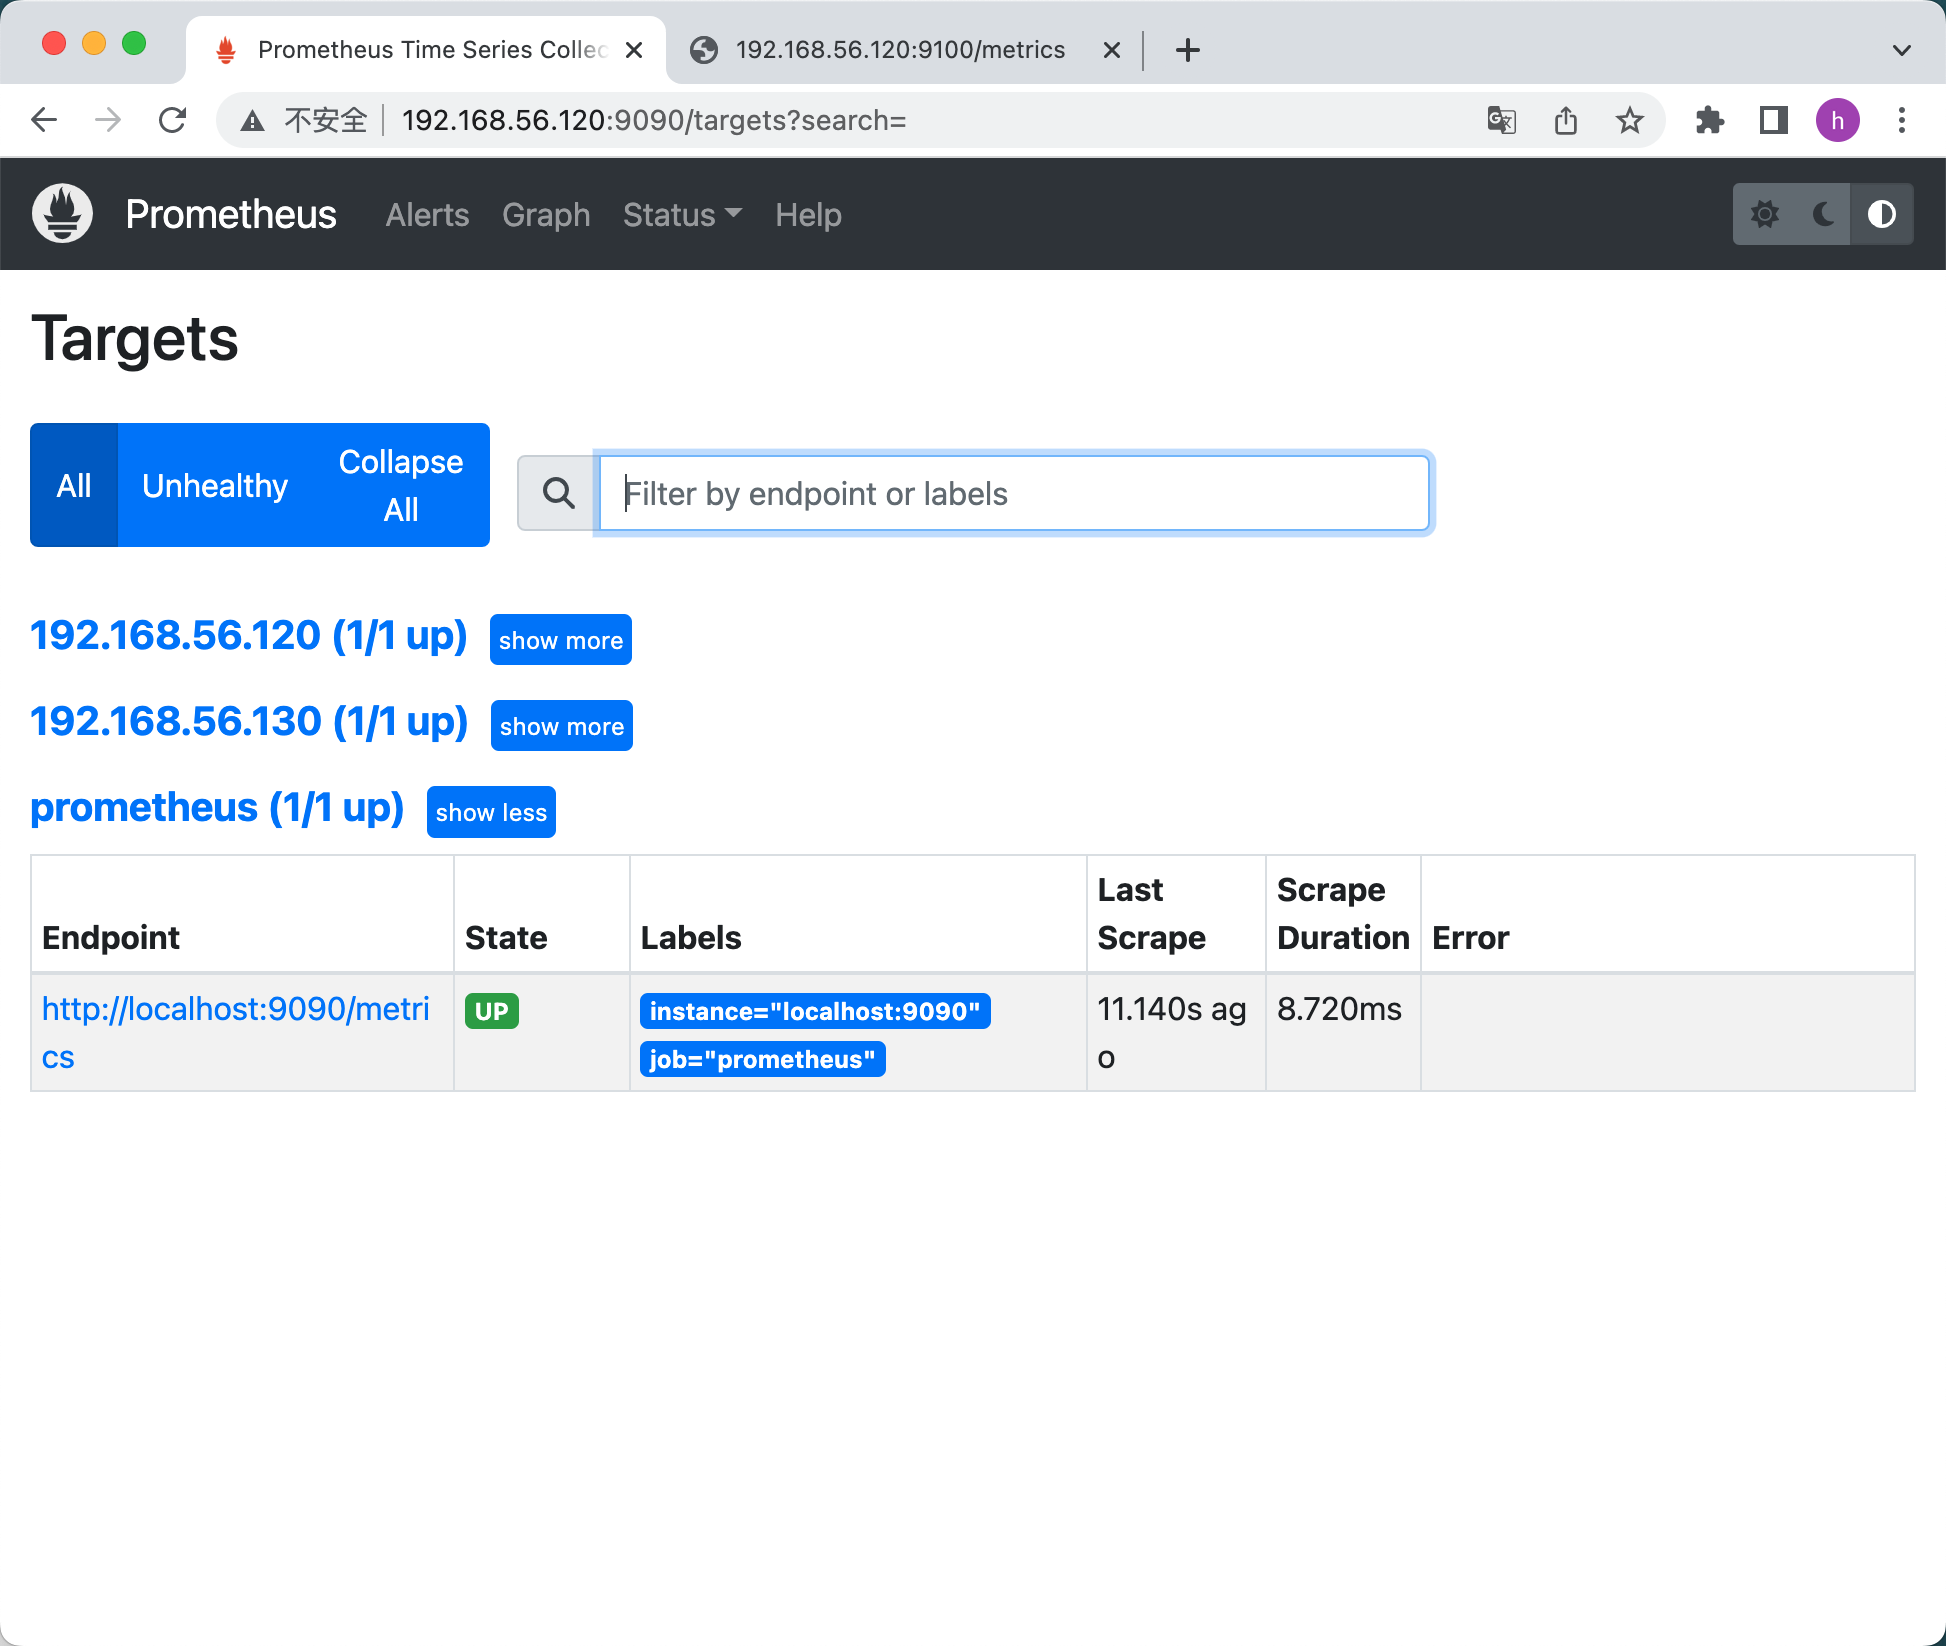
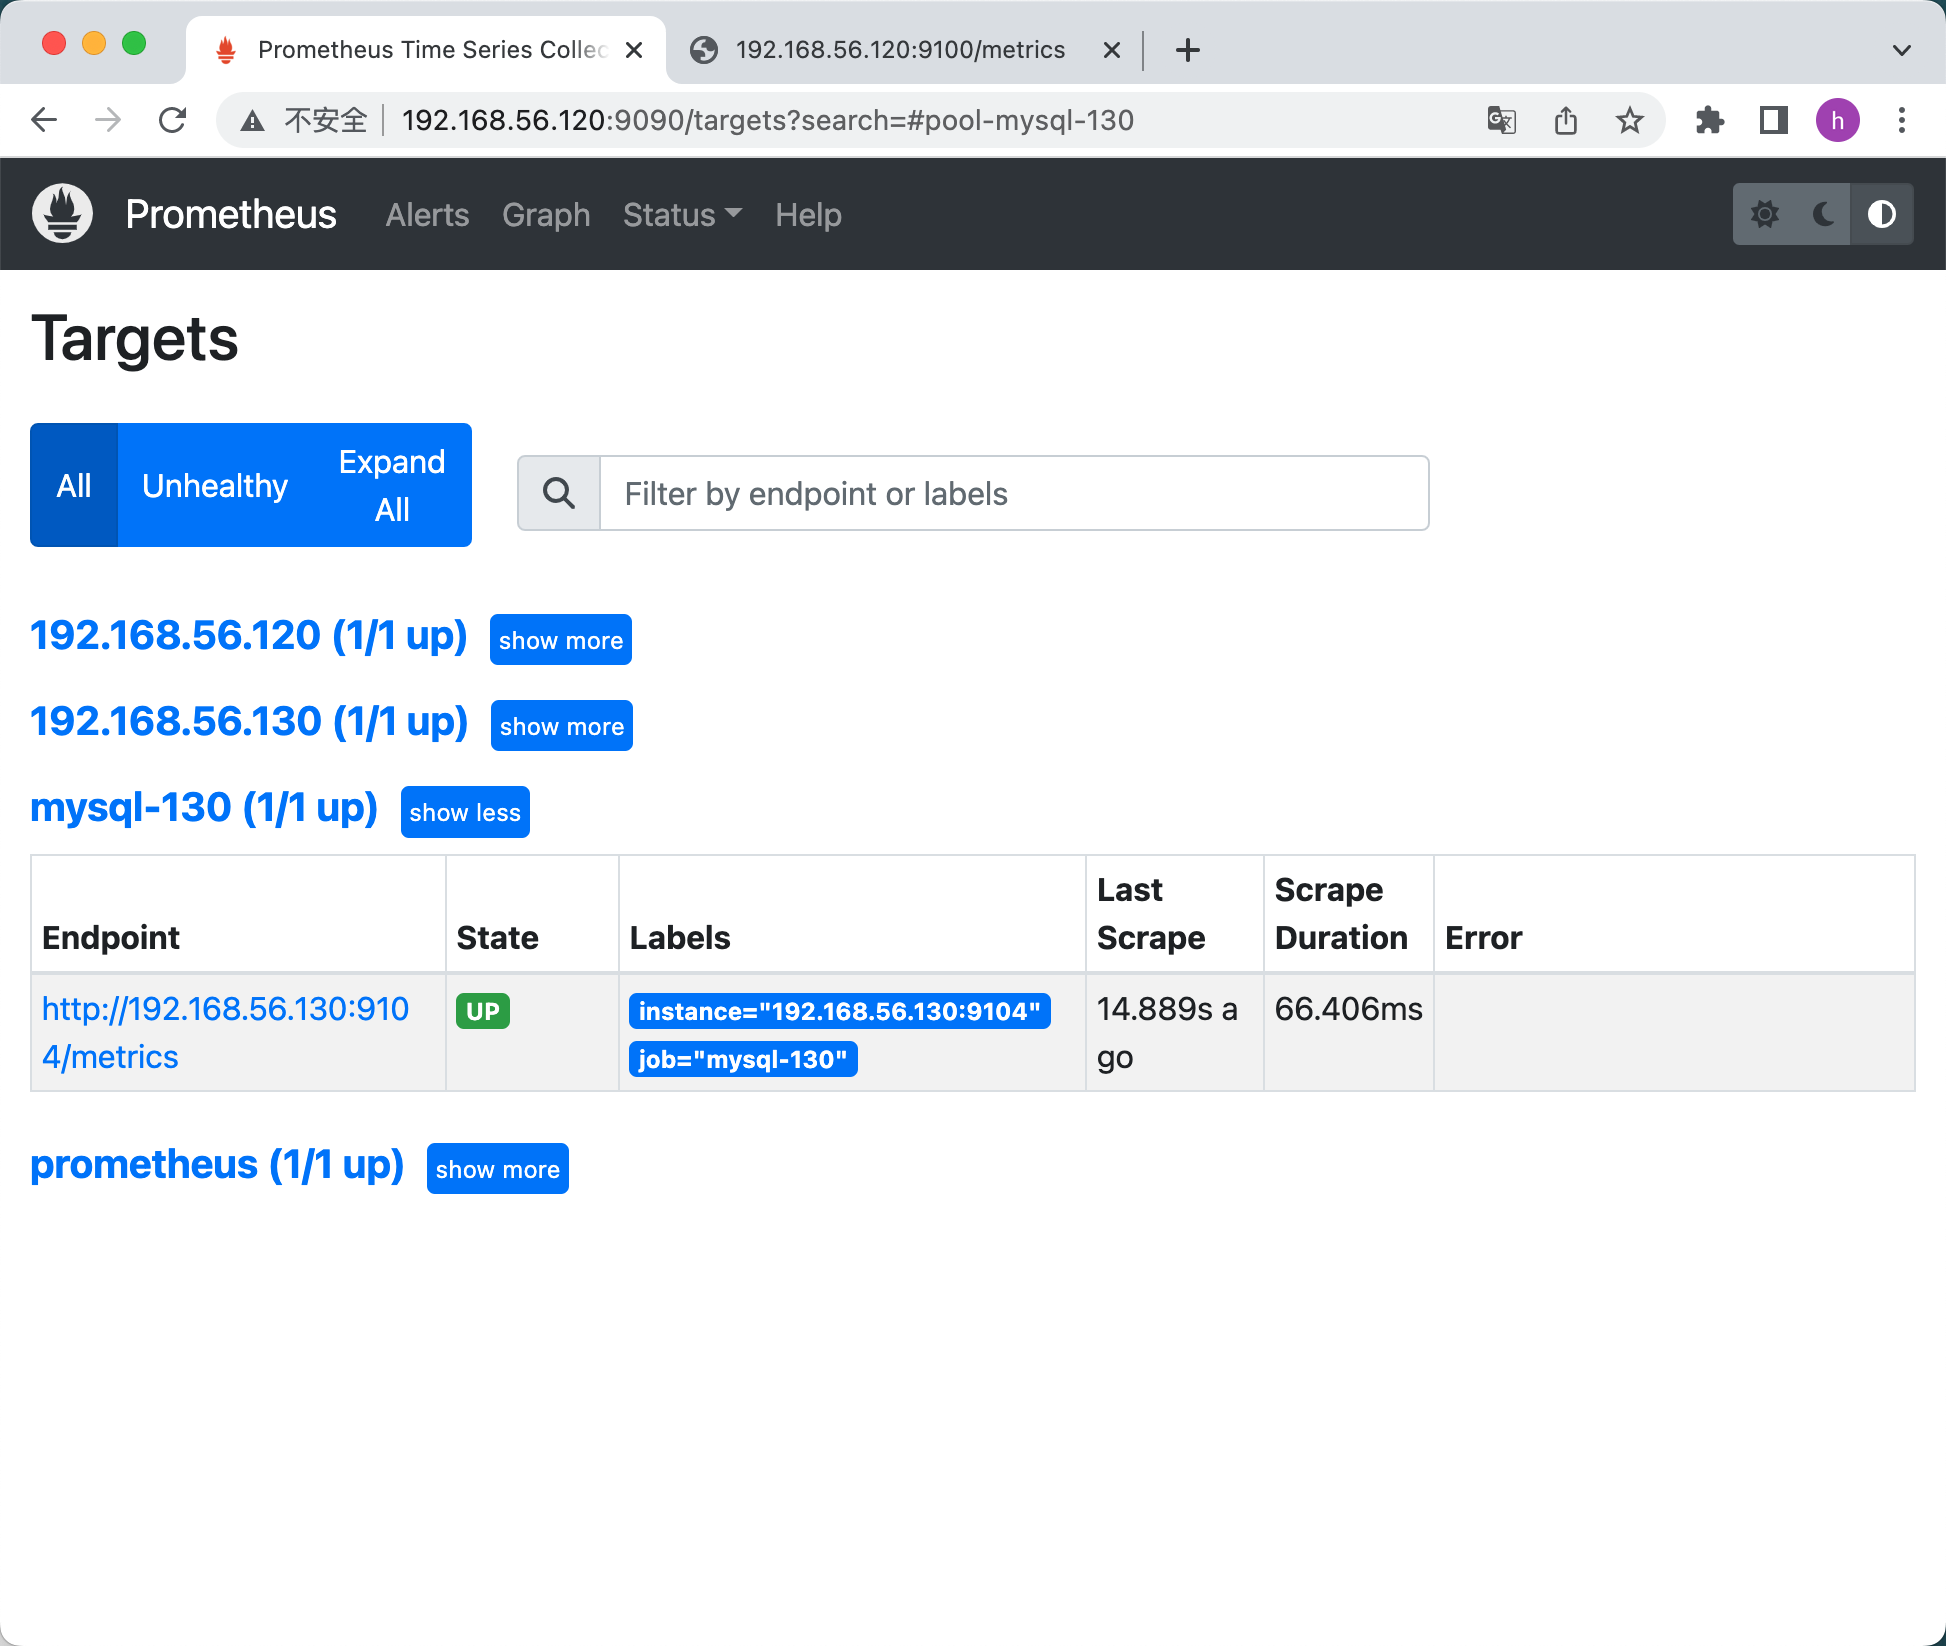
# 点Status-->Targets-->就可以看到监控的本机
# 通过http://服务器IP:9090/metrics可以查看到监控的数据
# 在web主界面可以通过关键字查询监控项
# 监控远程Linux主机 / 在被监控端上安装node_exporter组件
# 解压安装包
tar -xf node_exporter-1.5.0.linux-amd64.tar.gz -C /opt

# 创建链接目录
cd /opt
ln -s node_exporter-1.5.0.linux-amd64 node_exporter

# 使用nohup后台运行
nohup /opt/node_exporter/node_exporter &

# 确认是否正常启动(默认端口9100)
[root@mysql01 ~]# netstat -lnptu | grep 9100
tcp6       0      0 :::9100                 :::*                    LISTEN      20716/node_exporter

扩展: nohup命令: 如果把启动node_exporter的终端给关闭,那么进程也会
随之关闭。nohup命令会帮你解决这个问题。

通过浏览器访问http://被监控端IP:9100/metrics就可以查看到node_exporter在被监控端收集的监控信息

prometheus服务器的配置文件里添加被监控机器的配置段

在主配置文件最后面添加被监控主机信息

[root@ol8mysql opt]# vi /opt/prometheus/prometheus.yml

~~~
  - job_name: '192.168.56.120'      # 给被监控主机取个名字,我这里直接填的IP
    static_configs:
    - targets: ['192.168.56.120:9100']      # 这里填写被监控主机的IP和端口

  - job_name: '192.168.56.130'      # 给被监控主机取个名字,我这里直接填的IP
    static_configs:
    - targets: ['192.168.56.130:9100']      # 这里填写被监控主机的IP和端口

~~~

[root@ol8mysql opt]#

有多少台被监控主机就照格式添加在后面好了,我这里监控了120/130 主机

改完配置文件后,重启服务
pkill prometheus
/opt/prometheus/prometheus --config.file="/opt/prometheus/prometheus.yml" &
netstat -lnptu | grep 9090
监控远程MySQL / 在被管理MySQL服务器上安装mysqld_exporter组件
mysqld_exporter-0.14.0.linux-amd64.tar.gz

# 解压安装包
tar -xf mysqld_exporter-0.14.0.linux-amd64.tar.gz -C /opt

# 创建链接目录
cd /opt
ln -s mysqld_exporter-0.14.0.linux-amd64 mysqld_exporter

# 在MySQL服务器上创建监控用户

create user mysql_monitor@'localhost' identified with mysql_native_password by 'mysql';
grant select,replication client, process on *.* to 'mysql_monitor'@'localhost';
flush privileges;


# 将上面创建的mysql用户信息写入mysqld_exporter配置文件(新创建一个)
[root@mysql01 ~]# vim /opt/mysqld_exporter/.my.cnf
[client]
user=mysql_monitor
password=mysql
port=8032

# 启动mysqld_exporter
nohup /opt/mysqld_exporter/mysqld_exporter --config.my-cnf=/opt/mysqld_exporter/.my.cnf &

# 确认是否正常启动(默认端口9104)
[root@mysql01 ~]# netstat -lnptu | grep 9104


在主配置文件最后面添加被监控主机信息
 vi /opt/prometheus/prometheus.yml

  - job_name: 'mysql-130'      # 给被监控主机取个名字
    static_configs:
    - targets: ['192.168.56.130:9104']      # 这里填写被监控主机的IP和端口


有多少台被监控MySQL服务器就照格式添加在后面好了,这里监控了130 MySQL服务器

改完配置文件后,重启服务
pkill prometheus
/opt/prometheus/prometheus --config.file="/opt/prometheus/prometheus.yml" &
netstat -lnptu | grep 9090
mysql_global_status_threads_connected
http://192.168.56.120:9090
http://192.168.56.120:9090/metrics

http://192.168.56.130:9100
Grafana
wget https://dl.grafana.com/enterprise/release/grafana-enterprise-9.3.2-1.x86_64.rpm
sudo yum install grafana-enterprise-9.3.2-1.x86_64.rpm

直接下载rpm包就好
yum localinstall grafana-7.3.5-1.x86_64.rpm

启动服务并加入开机启动
systemctl start grafana-server.service
systemctl enable grafana-server.service

启动失败:
https://blog.csdn.net/weixin_41910699/article/details/127412027
最后通过/etc/passwd中没有grafana用户,查看文件属性,发现系统中重要文件加锁了;去掉锁就行
命令如下:
查看命令:
lsattr /etc/passwd
----i----------- /etc/passwd
删除限制
chattr -i /etc/passwd
其他的文件,同样操作
/etc/group
/etc/gshadow
/etc/shadow
#重新安装,启动成功
# rpm -qa | grep grafana
# rpm -qa | grep grafana
# yum localinstall grafana-enterprise-9.3.2-1.x86_64.rpm -y

Grafana启动报错
https://blog.csdn.net/ximenjianxue/article/details/125200854

https://blog.csdn.net/zzcmyssy/article/details/103181426


vi /etc/sysconfig/grafana-server
追加:
PID_FILE_PID=/var/run/grafana/grafana-server.pid

chown -R grafana:grafana /var/run/grafana
mkdir /var/run/grafana

启动服务并加入开机启动
systemctl start grafana-server.service
systemctl enable grafana-server.service

检查服务状态(默认使用3000端口)
systemctl status grafana-server.service

netstat -lnptu | grep 3000

通过浏览器访问 http:// grafana服务器IP:3000就到了登录界面,使用默认用户名admin,密码admin
- 登陆后会提示你修改密码,暂时不想修改话可以先跳过

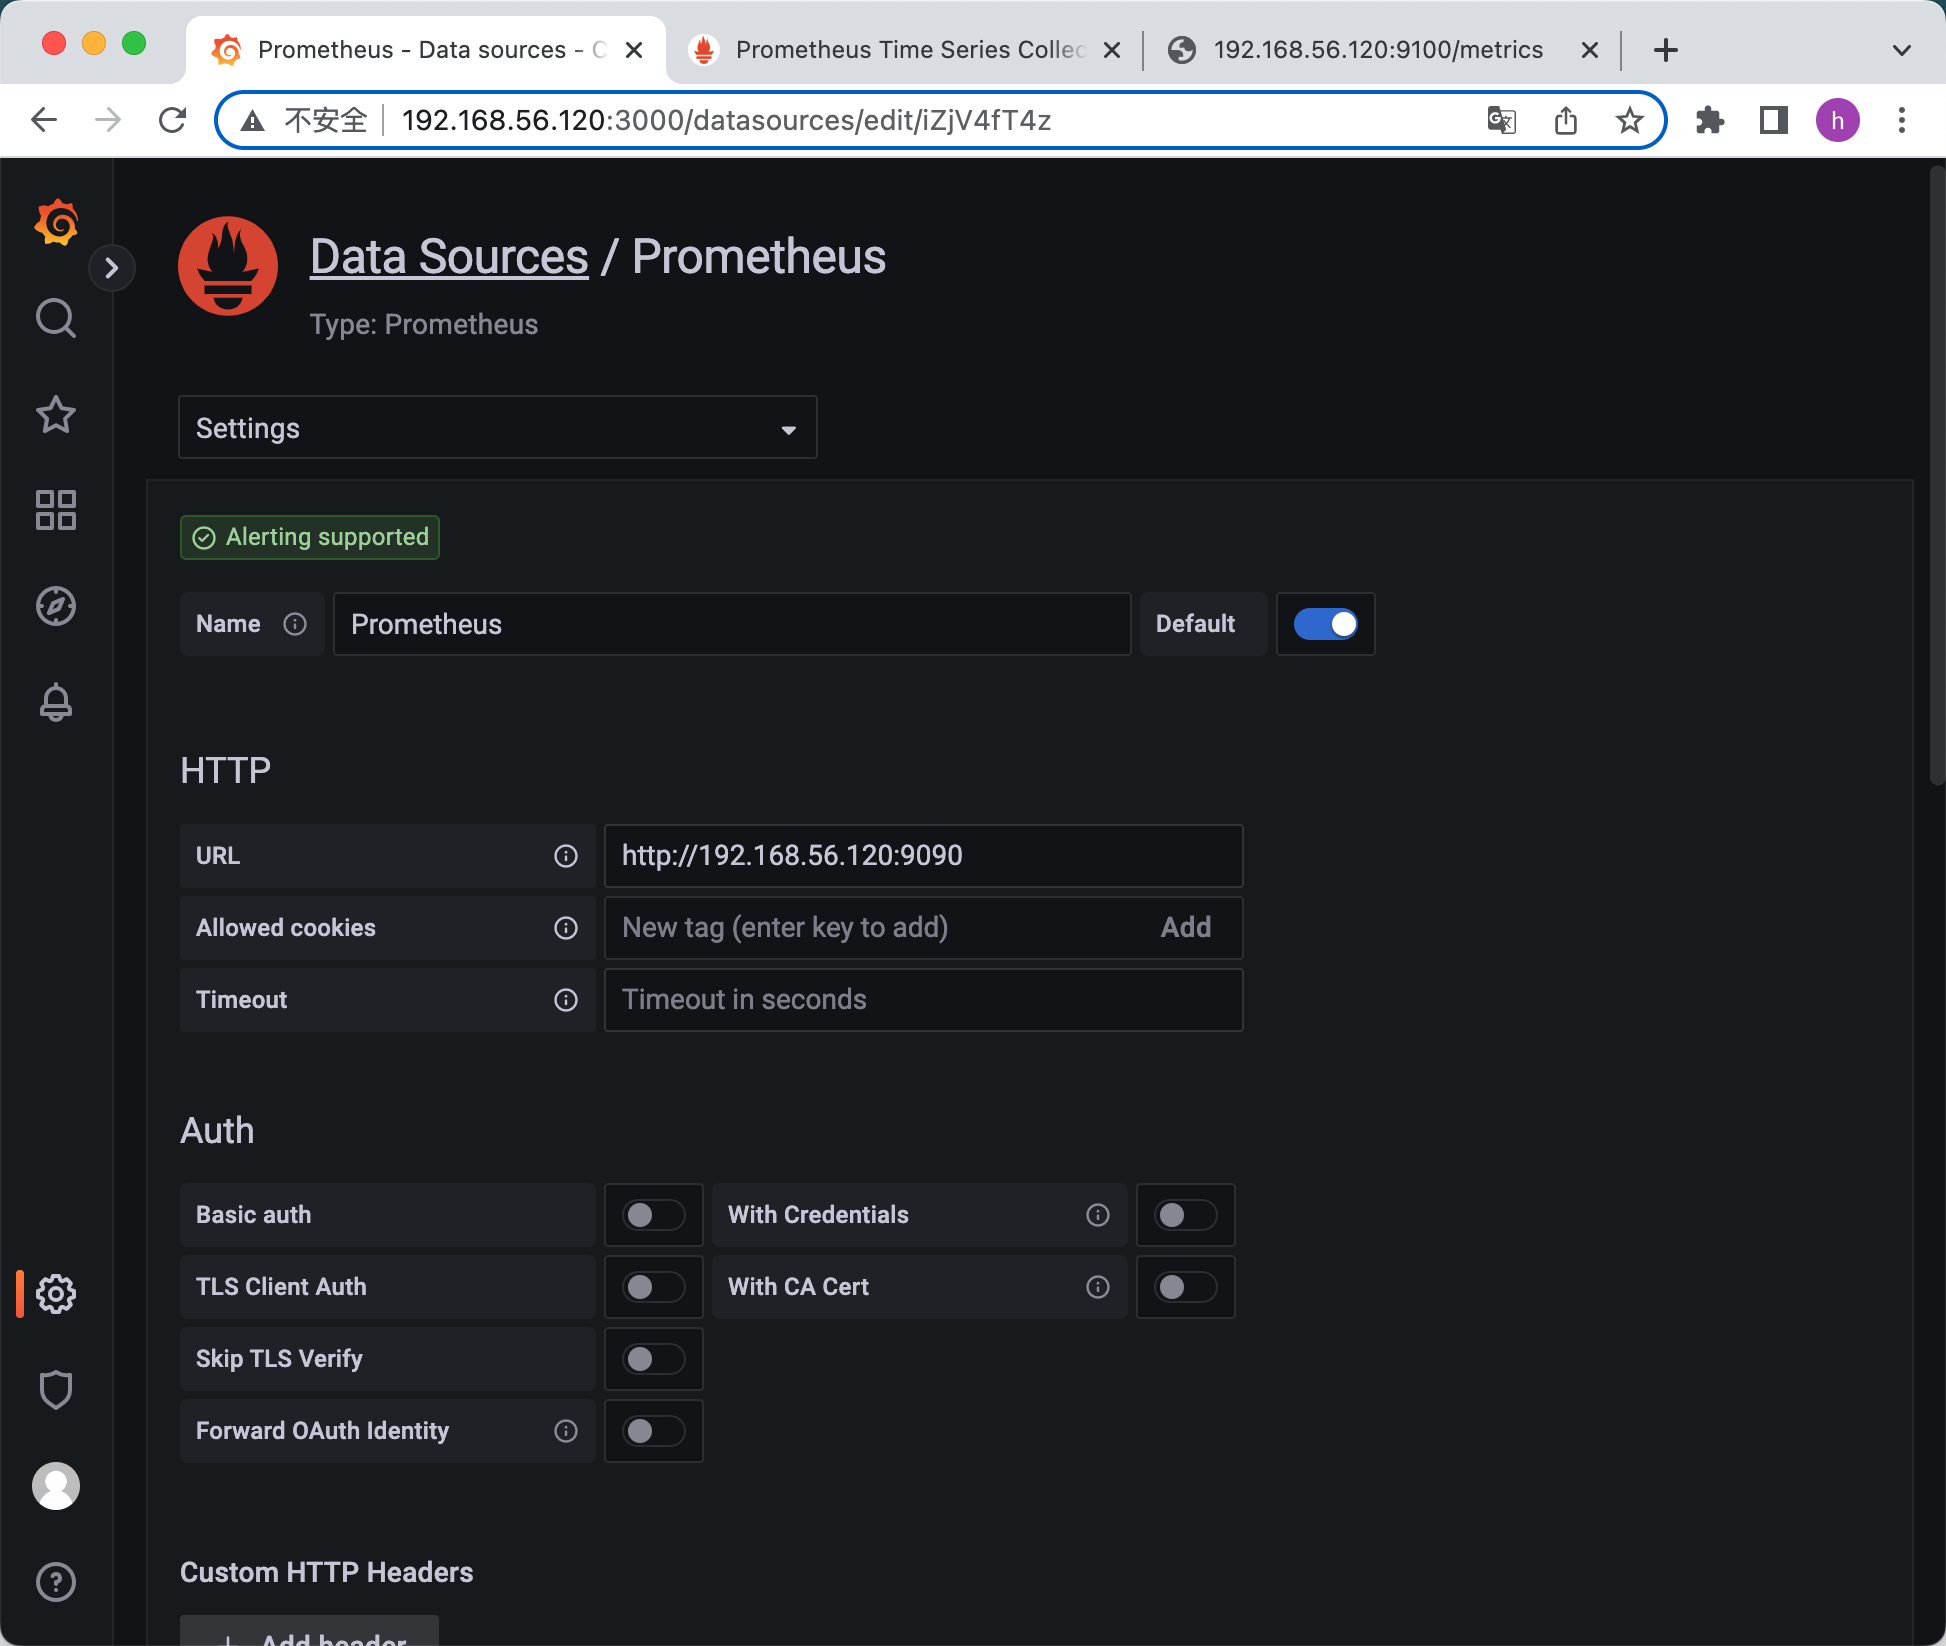
在Grafana上添加Prometheus数据源
我们把prometheus服务器收集的数据做为一个数据源添加到grafana,让grafana可以得到prometheus的数据
Data Sources / Prometheus
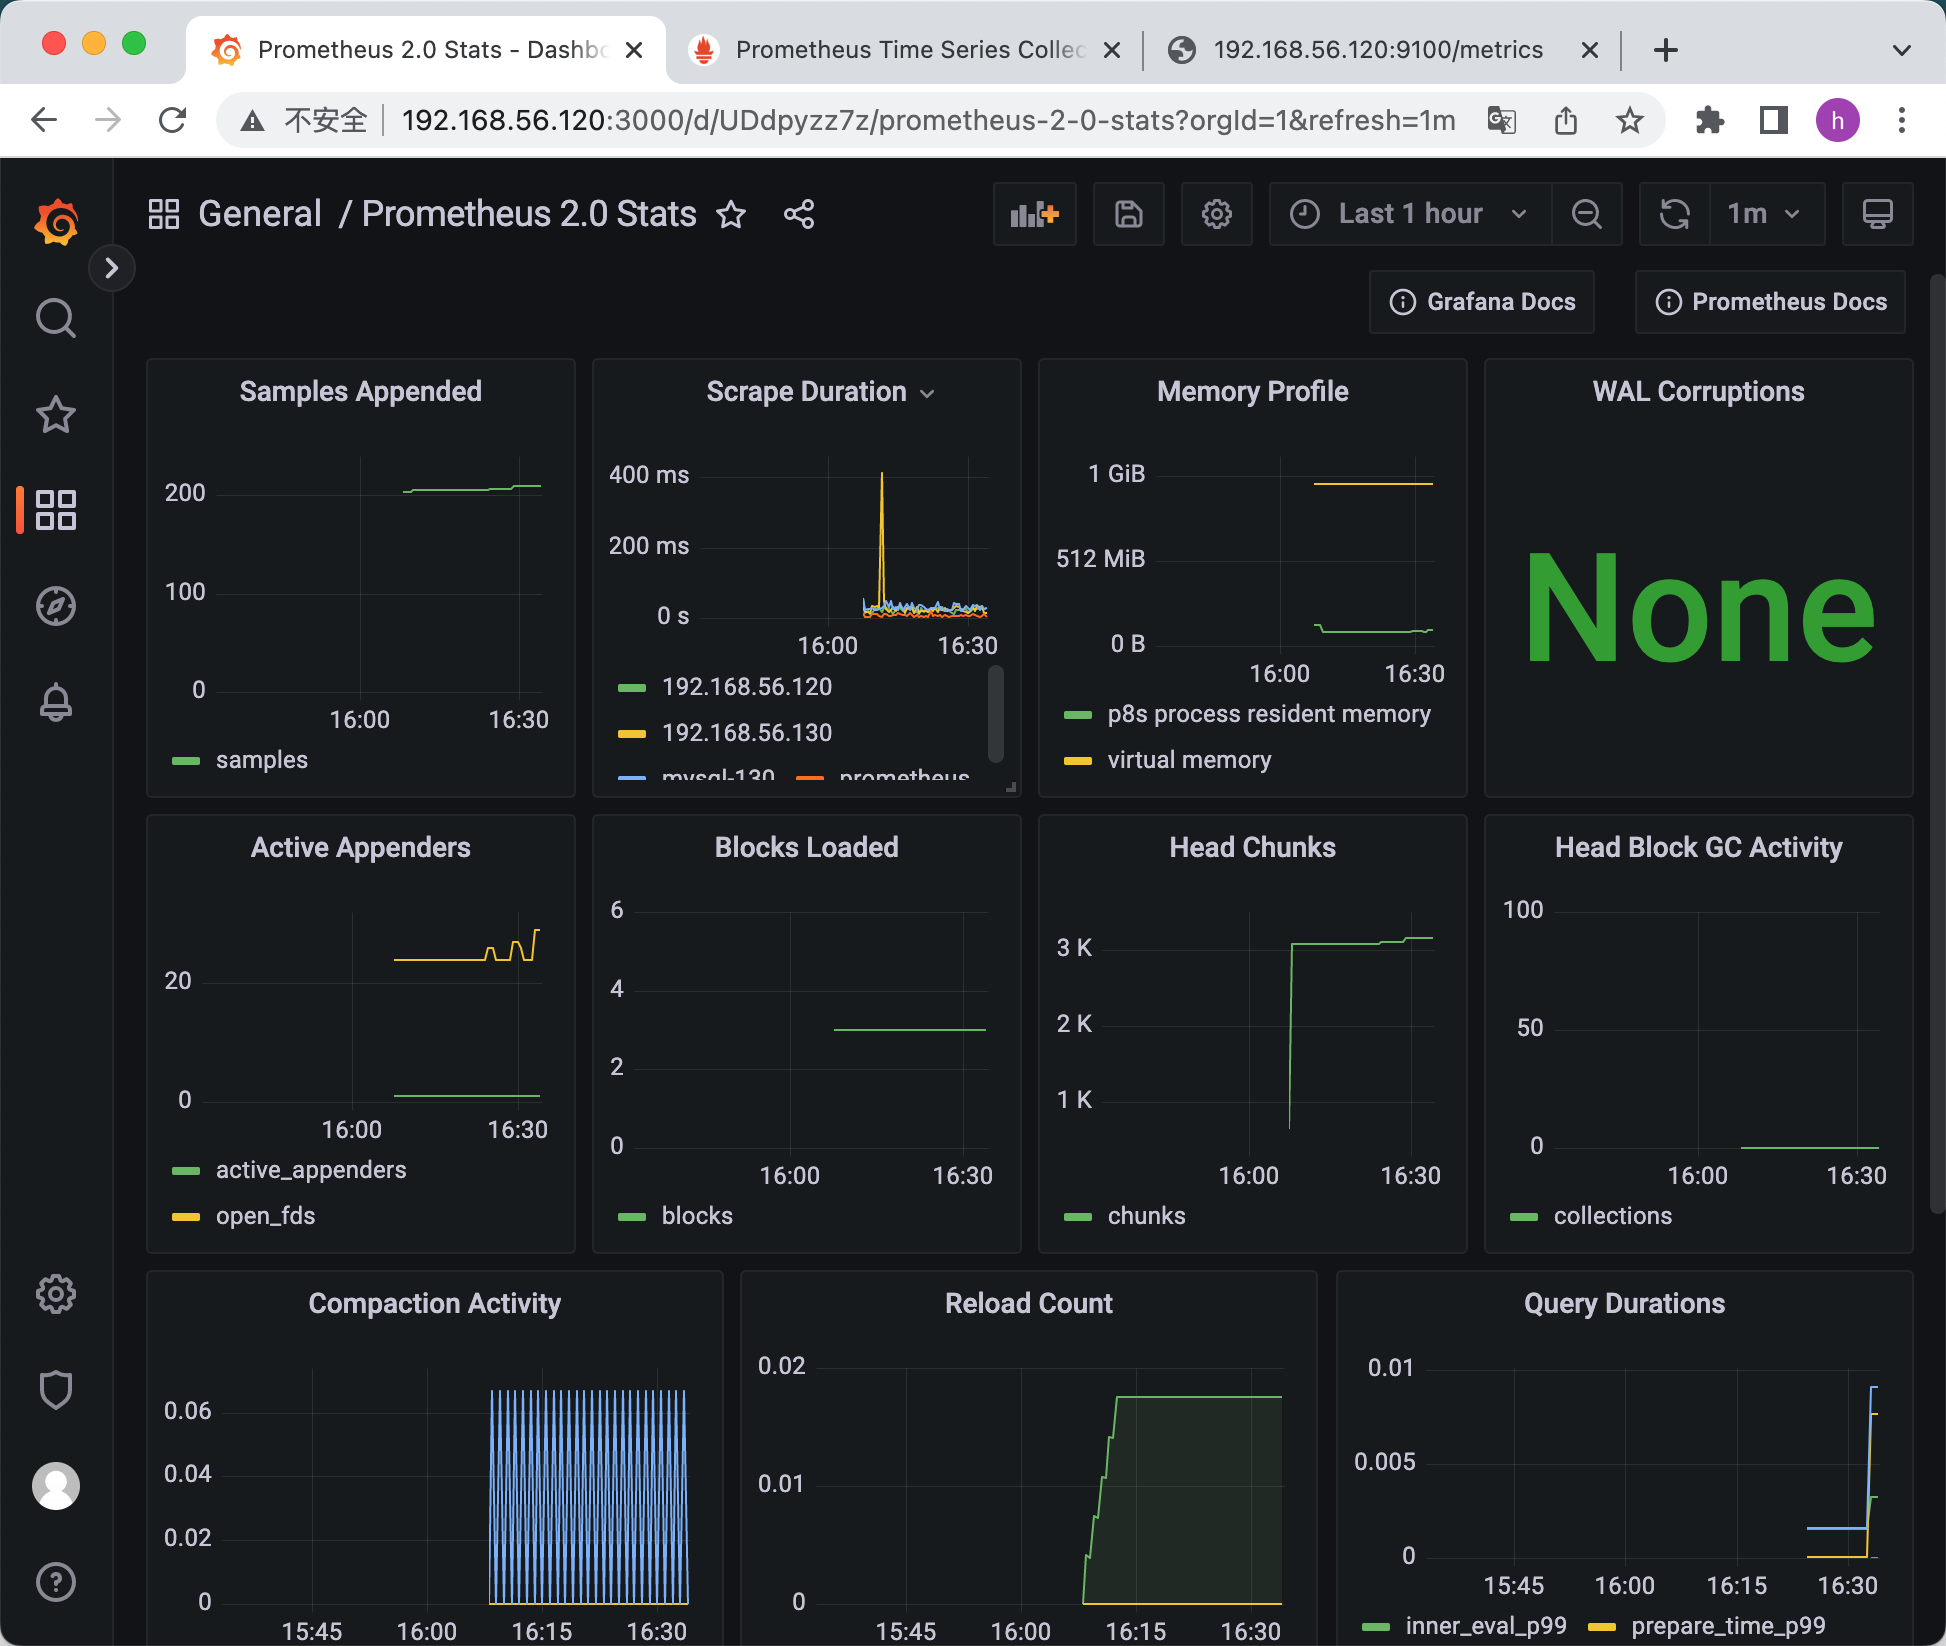
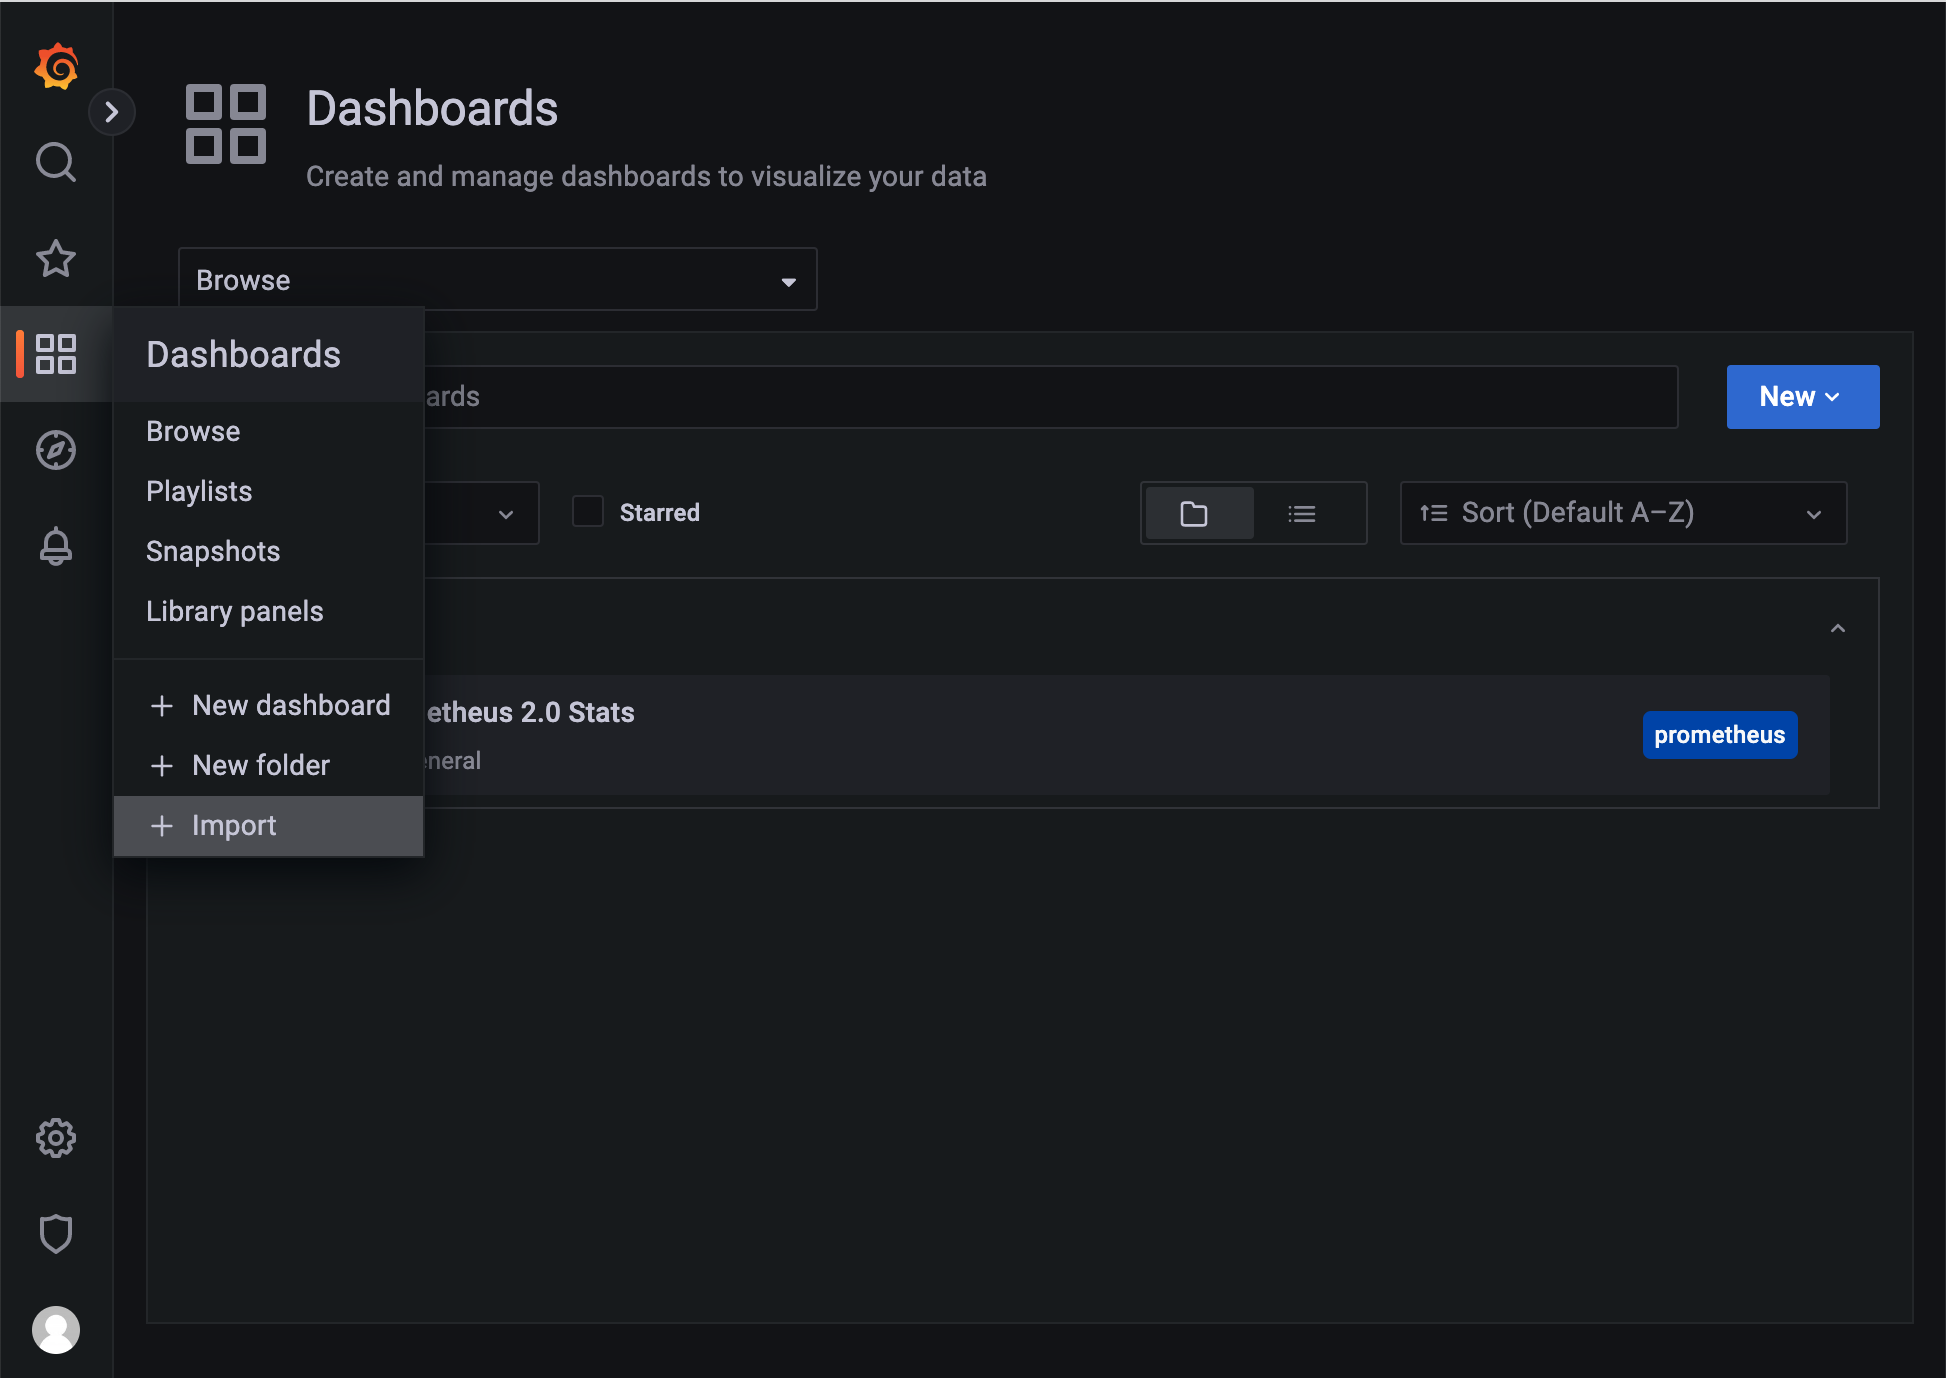
-> Prometheus 2.0 Stats / Import
Grafana官方提供模板地址:https://grafana.com/grafana/dashboards
本次要导入的模板:https://grafana.com/grafana/dashboards/11074
https://grafana.com/grafana/dashboards/8919-1-node-exporter-for-prometheus-dashboard-cn-0413-consulmanager/
Import: 8919 模版
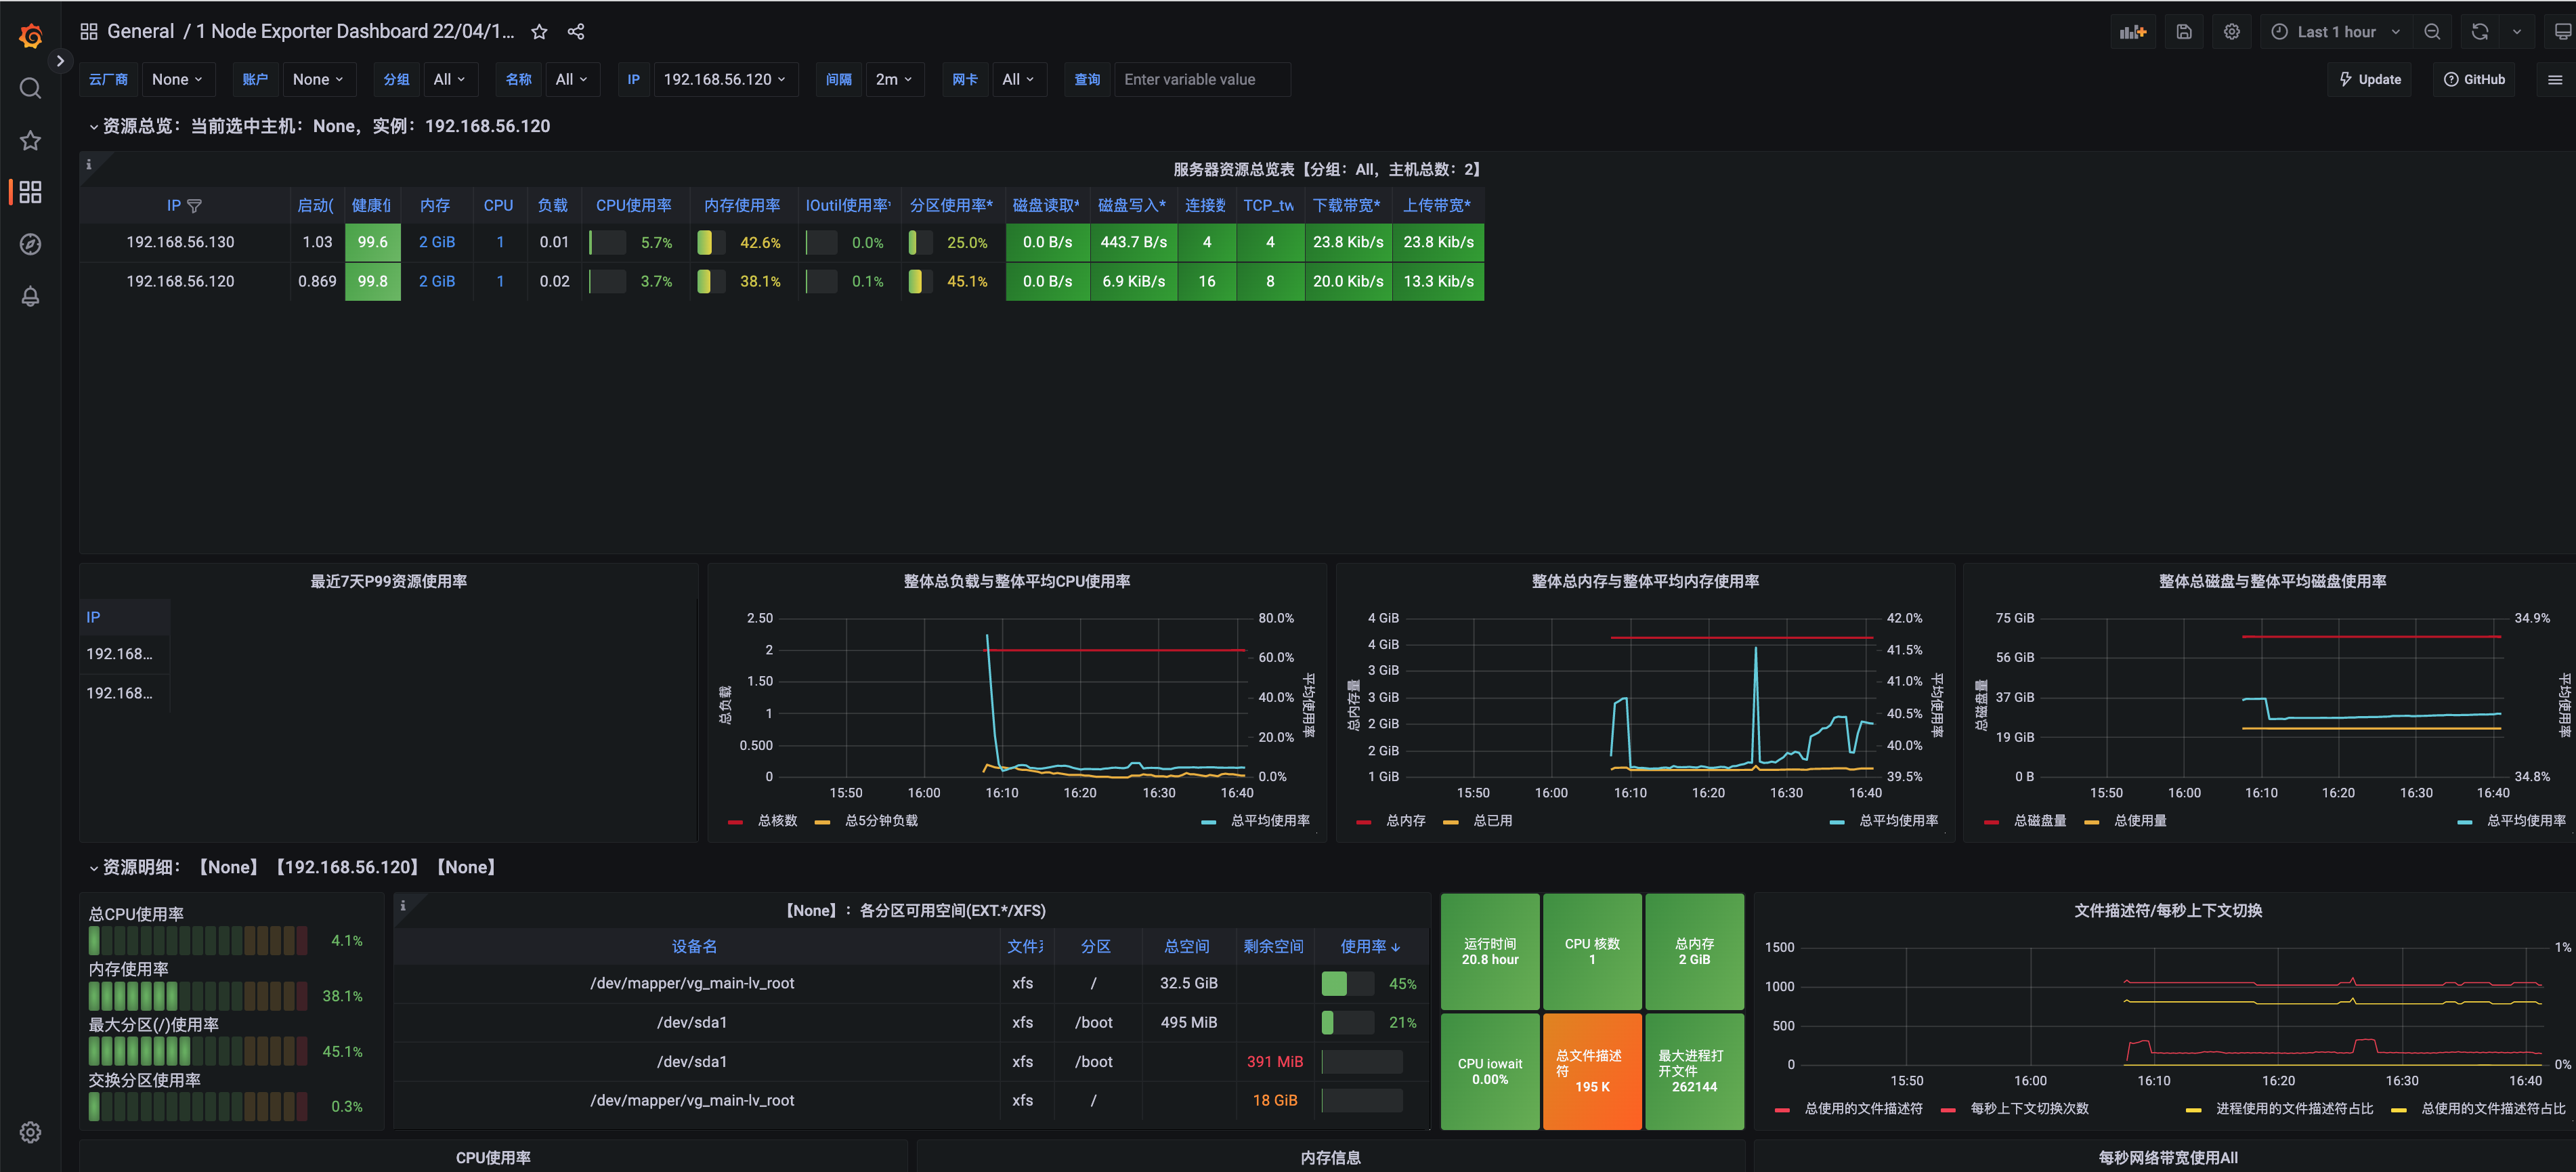
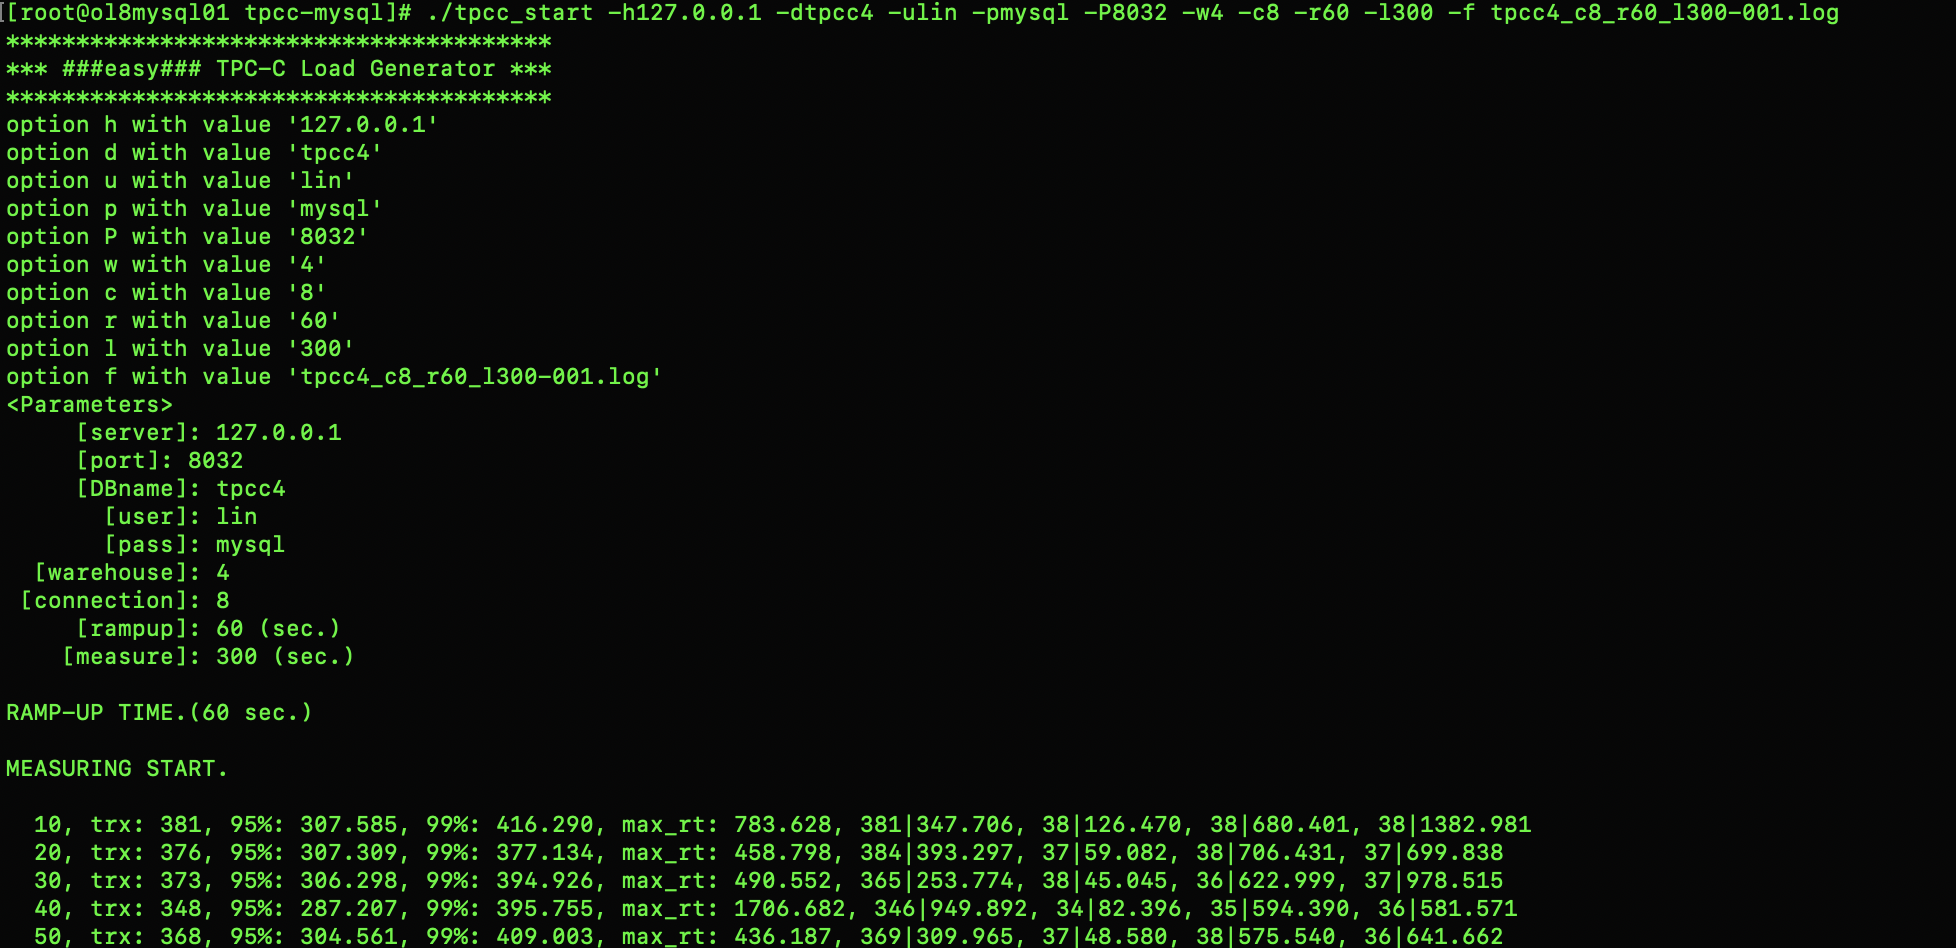
测试情况:
[root@ol8mysql01 tpcc-mysql]# ./tpcc_start -h127.0.0.1 -dtpcc4 -ulin -pmysql -P8032 -w4 -c8 -r60 -l300 -f tpcc4_c8_r60_l300-001.log
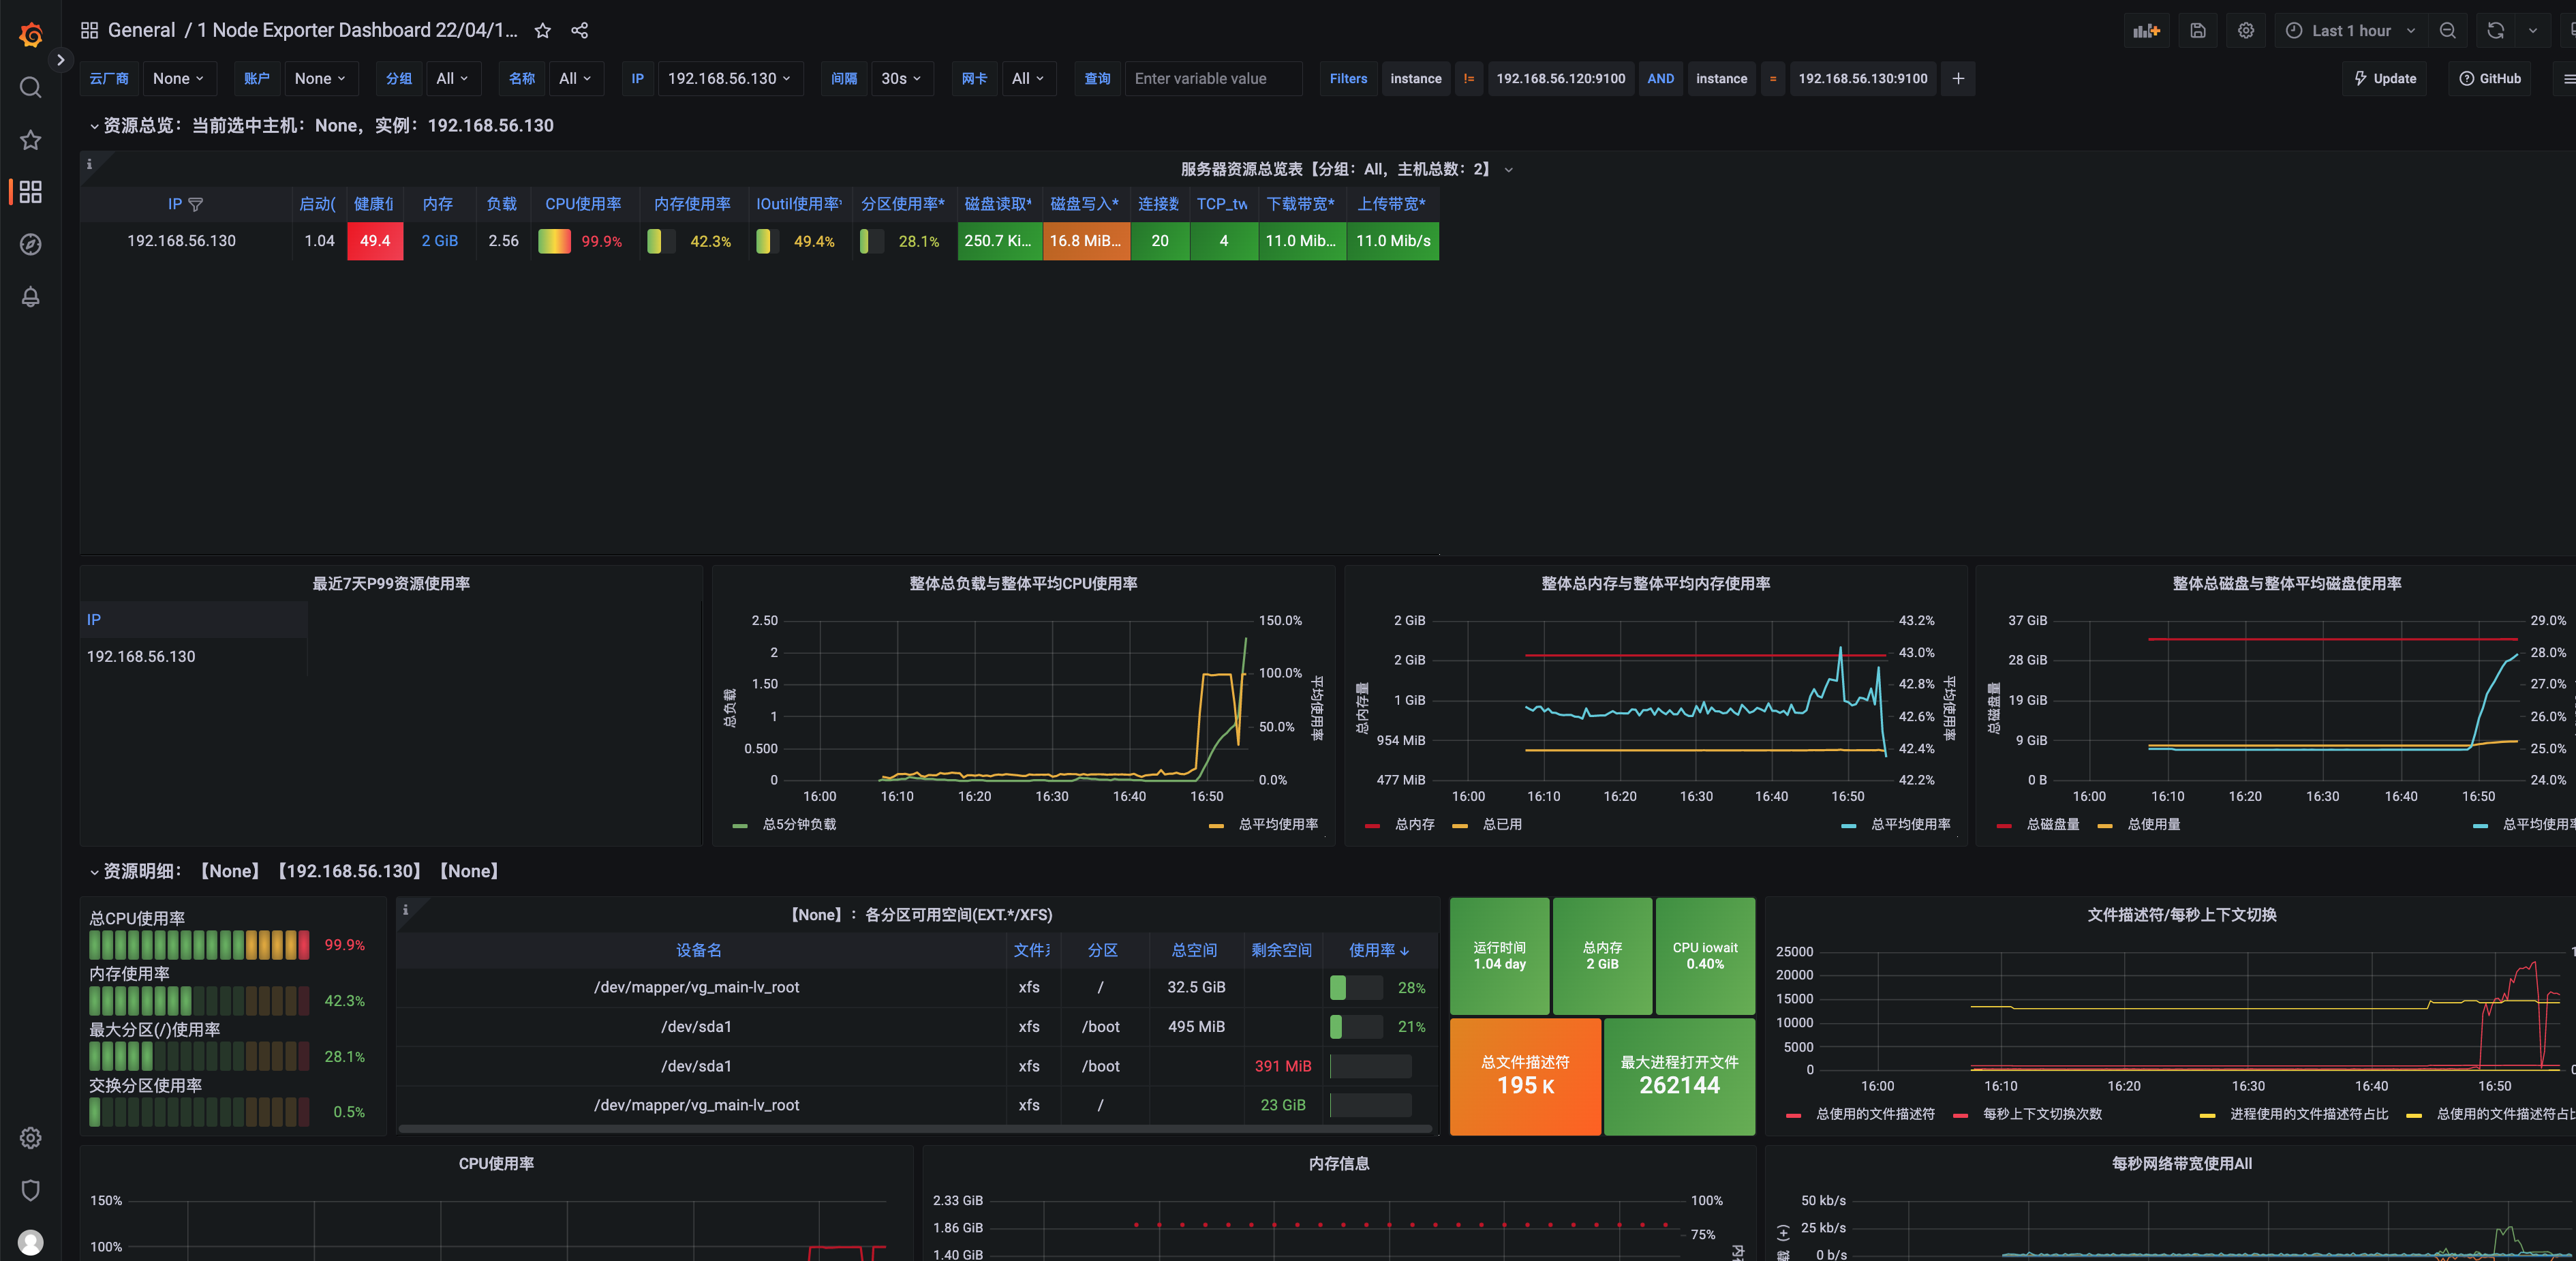
采用Prometheus+Grafana的安装部署方式实现对Linux系统主机的统一监控,Prometheus自带有监控功能,但不能简洁直观的反映出被监控端的详细信息。
采用grafana中提供的丰富的Dashboard页面,简洁直观的显示系统的各个参数的详细情况,给人焕然一新的感觉,便于维护管理。
Referece
参考:
Have a good work&life! 2023/01 via LinHong